Earlier the Census Bureau reported that overall construction spending decreased in September:
Both private and public spending decreased in September:
Note: Non-residential for offices and hotels is increasing, but spending for oil and gas is declining. Early in the recovery, there was a surge in non-residential spending for oil and gas (because prices increased), but now, with falling prices, oil and gas is a drag on overall construction spending.
As an example, construction spending for lodging is up 15% year-over-year, whereas spending for power (includes oil and gas) construction is down 11% since peaking in May.
 Click on graph for larger image.
This graph shows private residential and nonresidential construction spending, and public spending, since 1993. Note: nominal dollars, not inflation adjusted.
Private residential spending has declined recently and is 48% below the peak in early 2006 - but up 53% from the post-bubble low.
Non-residential spending is 20% below the peak in January 2008, and up about 47% from the recent low.
Public construction spending is now 17% below the peak in March 2009 and about 4% above the post-recession low.
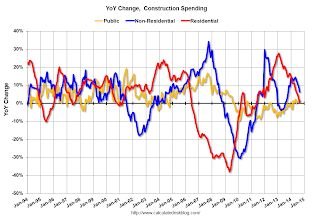 The second graph shows the year-over-year change in construction spending.
On a year-over-year basis, private residential construction spending is now up 1%. Non-residential spending is up 6% year-over-year. Public spending is up 2% year-over-year.
Looking forward, all categories of construction spending should increase in 2015. Residential spending is still very low, non-residential is starting to pickup, and public spending has probably hit bottom after several years of austerity.
This was a weak report - well below the consensus forecast of a 0.6% increase - and there were also downward revisions to spending in July and August.
from Calculated Risk http://ift.tt/1s8kceE
via YQ Matrix
The U.S. Census Bureau of the Department of Commerce announced today that construction spending during September 2014 was estimated at a seasonally adjusted annual rate of $950.9 billion, 0.4 percent below the revised August estimate of $955.2 billion.. The September figure is 2.9 percent (±2.1%) above the September 2013 estimate of $924.2 billion.
Both private and public spending decreased in September:
Spending on private construction was at a seasonally adjusted annual rate of $680.0 billion, 0.1 percent below the revised August estimate of $680.8 billion. Residential construction was at a seasonally adjusted annual rate of $349.1 billion in September, 0.4 percent above the revised August estimate of $347.7 billion. Nonresidential construction was at a seasonally adjusted annual rate of $331.0 billion in September, 0.6 percent below the revised August estimate of $333.0 billion. ...
In September, the estimated seasonally adjusted annual rate of public construction spending was $270.9 billion, 1.3 percent below the revised August estimate of $274.4 billion.
emphasis added
Note: Non-residential for offices and hotels is increasing, but spending for oil and gas is declining. Early in the recovery, there was a surge in non-residential spending for oil and gas (because prices increased), but now, with falling prices, oil and gas is a drag on overall construction spending.
As an example, construction spending for lodging is up 15% year-over-year, whereas spending for power (includes oil and gas) construction is down 11% since peaking in May.
This graph shows private residential and nonresidential construction spending, and public spending, since 1993. Note: nominal dollars, not inflation adjusted.
Private residential spending has declined recently and is 48% below the peak in early 2006 - but up 53% from the post-bubble low.
Non-residential spending is 20% below the peak in January 2008, and up about 47% from the recent low.
Public construction spending is now 17% below the peak in March 2009 and about 4% above the post-recession low.
On a year-over-year basis, private residential construction spending is now up 1%. Non-residential spending is up 6% year-over-year. Public spending is up 2% year-over-year.
Looking forward, all categories of construction spending should increase in 2015. Residential spending is still very low, non-residential is starting to pickup, and public spending has probably hit bottom after several years of austerity.
This was a weak report - well below the consensus forecast of a 0.6% increase - and there were also downward revisions to spending in July and August.
from Calculated Risk http://ift.tt/1s8kceE
via YQ Matrix
No comments:
Post a Comment