The key report this week is the January employment report on Friday.
Other key indicators include January vehicle sales, the January ISM manufacturing and non-manufacturing indexes, and the December trade deficit.
----- Monday, February 1st -----
8:30 AM ET:
Personal Income and Outlays for December. The consensus is for a 0.3% increase in personal income, and for a 0.1% increase in personal spending. And for the Core PCE price index to increase 0.1%.
10:00 AM:
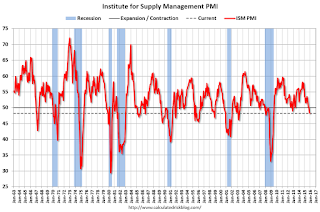
ISM Manufacturing Index for January. The consensus is for the ISM to be at 48.3, up from 48.2 in December.
Here is a long term graph of the ISM manufacturing index.
The ISM manufacturing index indicated contraction at 48.2% in December. The employment index was at 48.3%, and the new orders index was at 49.2%.
10:00 AM:
Construction Spending for December. The consensus is for a 0.6% increase in construction spending.
1:00 PM:
Discussion, Fed Vice Chairman Stanley Fischer,
Recent Monetary Policy, Council on Foreign Relations Event: C. Peter McColough Series on International Economics, New York, N.Y.
----- Tuesday, February 2nd -----

All day:
Light vehicle sales for January. The consensus is for light vehicle sales to increase to 17.5 million SAAR in January from 17.2 million in December (Seasonally Adjusted Annual Rate).
This graph shows light vehicle sales since the BEA started keeping data in 1967. The dashed line is the December sales rate.
----- Wednesday, February 3rd -----
7:00 AM ET: The Mortgage Bankers Association (MBA) will release the results for the
mortgage purchase applications index.
8:15 AM: The
ADP Employment Report for January. This report is for private payrolls only (no government). The consensus is for 190,000 payroll jobs added in January, down from 257,000 in December.
10:00 AM: the
ISM non-Manufacturing Index for January. The consensus is for index to be increased to 55.5 in January from 55.3 in December.
----- Thursday, February 4th -----
8:30 AM: The
initial weekly unemployment claims report will be released. The consensus is for 280 thousand initial claims, up from 278 thousand the previous week.
10:00 AM:
Manufacturers' Shipments, Inventories and Orders (Factory Orders) for December. The consensus is a 2.8% decrease in orders.
----- Friday, February 5th -----
8:30 AM:
Employment Report for January. The consensus is for an increase of 188,000 non-farm payroll jobs added in January, down from the 292,000 non-farm payroll jobs added in December.
The consensus is for the unemployment rate to be unchanged at 5.0%.

This graph shows the year-over-year change in total non-farm employment since 1968.
In December, the year-over-year change was 2.65 million jobs.
A key will be the change in real wages - and as the unemployment rate falls, wage growth should pickup.

8:30 AM:
Trade Balance report for December from the Census Bureau.
This graph shows the U.S. trade deficit, with and without petroleum, through October. The blue line is the total deficit, and the black line is the petroleum deficit, and the red line is the trade deficit ex-petroleum products.
The consensus is for the U.S. trade deficit to be at $43.0 billion in December from $42.4 billion in November.
3:00 PM:
Consumer Credit for December from the Federal Reserve. The consensus is for an increase of $16.5 billion in credit.

from Calculated Risk http://ift.tt/1JOWJxS
via
YQ Matrix