Sunday 31 July 2016

Monday: ISM Mfg, Construction Spending

Weekend:
Schedule for Week of July 31, 2016

Monday:
• At 10:00 AM ET: ISM Manufacturing Index for July. The consensus is for the ISM to be at 53.2, unchanged from June. The ISM manufacturing index indicated expansion at 53.2% in June. The employment index was at 50.4%, and the new orders index was at 57.0%.

• Also at 10:00 AM: Construction Spending for June. The consensus is for a 0.6% increase in construction spending.

• At 2:00 PM, the July 2016 Senior Loan Officer Opinion Survey on Bank Lending Practices from the Federal Reserve.

From CNBC: Pre-Market Data and Bloomberg futures: S&P are up 3 and DOW futures are up 38 (fair value).

Oil prices were down over the last week with WTI futures at $41.34 per barrel and Brent at $43.25 per barrel.  A year ago, WTI was at $47, and Brent was at $53 - so prices are down 15% to 20% year-over-year.

Here is a graph from Gasbuddy.com for nationwide gasoline prices. Nationally prices are at $2.13 per gallon (down over $0.55 per gallon from a year ago).

from Calculated Risk http://ift.tt/2aDepQm
via YQ Matrix

CoStar: Commercial Real Estate prices increased in June

Here is a price index for commercial real estate that I follow. 

From CoStar: Commercial Property Price Growth Rebounds In Second Quarter
CRE PRICE INDICES RESUMED HEALTHY GROWTH IN SECOND QUARTER. After experiencing modest growth in the first quarter of 2016 in the wake of global economic uncertainty, both CCRSI’s national composite price indices ended the second quarter of 2016 on a stronger note as investor confidence rebounded. The value-weighted U.S. Composite Index, which is influenced by the sale of high-quality, larger assets, advanced by 3.3%, while the equal-weighted U.S. Composite Index, which reflects the more numerous sales of smaller properties, rose 2.1% in the second quarter of 2016.

HOWEVER, THE PACE OF PRICE GROWTH HAS MODERATED ON AN ANNUAL BASIS. While price growth resumed in both composite indices during the second quarter of 2016, the rate of increase has dropped into the single digits as of June 2016 from a double-digit annual pace in the 12-month periods ending in June 2014 and June 2015. This suggests the pace of price growth may continue to plateau in 2016 as the current cycle advances. ...
emphasis added
Commercial Real Estate Prices Click on graph for larger image.

This graph from CoStar shows the the value-weighted U.S. Composite Index and the equal-weighted U.S. Composite Index indexes.

The value-weighted index increased 1.4% in June and is up 9.0% year-over-year.

The equal-weighted index increased 1.3% in May and is up 6.8% year-over-year.

Note: These are repeat sales indexes - like Case-Shiller for residential - but this is based on far fewer pairs.

from Calculated Risk http://ift.tt/2amu6ag
via YQ Matrix

Saturday 30 July 2016

Schedule for Week of July 31, 2016

The key report this week is the July employment report on Friday.

Other key indicators include the June ISM manufacturing and non-manufacturing indexes, July auto sales, and the June trade deficit.

----- Monday, Aug 1st -----

ISM PMI10:00 AM: ISM Manufacturing Index for July. The consensus is for the ISM to be at 53.2, unchanged from 53.2 in June.

Here is a long term graph of the ISM manufacturing index.

The ISM manufacturing index indicated expansion at 53.2% in June. The employment index was at 50.4%, and the new orders index was at 57.0%.

10:00 AM: Construction Spending for June. The consensus is for a 0.6% increase in construction spending.

2:00 PM ET: the July 2016 Senior Loan Officer Opinion Survey on Bank Lending Practices from the Federal Reserve.

----- Tuesday, Aug 2nd -----

8:30 AM: Personal Income and Outlays for June. The consensus is for a 0.3% increase in personal income, and for a 0.3% increase in personal spending. And for the Core PCE price index to increase 0.1%.

Vehicle SalesAll day: Light vehicle sales for July. The consensus is for light vehicle sales to increase to 17.3 million SAAR in July, from 16.6 million in June (Seasonally Adjusted Annual Rate).

This graph shows light vehicle sales since the BEA started keeping data in 1967. The dashed line is the June sales rate.

----- Wednesday, Aug 3rd -----

7:00 AM ET: The Mortgage Bankers Association (MBA) will release the results for the mortgage purchase applications index.

8:15 AM: The ADP Employment Report for July. This report is for private payrolls only (no government). The consensus is for 165,000 payroll jobs added in July, down from 172,000 added in June.

10:00 AM: the ISM non-Manufacturing Index for July. The consensus is for index to decrease to 56.0 from 56.5 in June.

----- Thursday, Aug 4th -----

8:30 AM ET: The initial weekly unemployment claims report will be released.  The consensus is for 265 thousand initial claims, down from 266 thousand the previous week.

10:00 AM: Manufacturers' Shipments, Inventories and Orders (Factory Orders) for June. The consensus is a 1.8% decrease in orders.

----- Friday, Aug 5th -----

8:30 AM: Employment Report for July. The consensus is for an increase of 185,000 non-farm payroll jobs added in July, down from the 287,000 non-farm payroll jobs added in June.

The consensus is for the unemployment rate to decrease to 4.8%.

Year-over-year change employmentThis graph shows the year-over-year change in total non-farm employment since 1968.

In June, the year-over-year change was 2.45 million jobs.

A key will be the change in wages.

U.S. Trade Deficit8:30 AM: Trade Balance report for June from the Census Bureau.

This graph shows the U.S. trade deficit, with and without petroleum, through May. The blue line is the total deficit, and the black line is the petroleum deficit, and the red line is the trade deficit ex-petroleum products.

The consensus is for the U.S. trade deficit to be at $43.0 billion in June from $41.1 billion in May.

3:00 PM: Consumer credit from the Federal Reserve.  The consensus is for a $15.5 billion increase in credit.

from Calculated Risk http://ift.tt/2aE4Kdu
via YQ Matrix

Friday 29 July 2016

Lawler: Homebuilder Summary Table for Q2 2016

CR Note: Housing economist Tom Lawler sent me these summary results for several large publicly-traded builders who have reported results for last quarter.

Lawler notes: CalAtlantic was formed with the merger of Standard Pacific and Ryland, completed in October 2015. The Q2/2015 statistics for CalAtlantic are pro forma statistics for Standard Pacific and Ryland combined. Also, while MDC Holdings has not yet released its “official” results for Q2/2016, it did release preliminary estimates of selected operations statistics for the quarter, which are shown above.

  Net Orders Settlements Average Closing
Price (000s)
Qtr. Ended: 6/30/16 6/30/15 % Chg 6/30/16 6/30/15 % Chg 6/30/16 6/30/15 % Chg
D.R.
Horton
11,714 10,398 12.7% 10,739 9,856 9.0% $290 290 0.2%
Pulte
Group
5,697 5,118 11.3% 4,772 3,744 27.5% $367 332 10.5%
NVR 4,324 3,796 13.9% 3,581 3,175 12.8% $379 384 -1.5%
Cal
Atlantic
3,921 3,954 -0.8% 3,484 3,119 11.7% $447 427 4.7%
Beazer
Homes
1,490 1,524 -2.2% 1,364 1,293 5.5% $330 318 4.0%
Meritage
Homes
2,073 1,986 4.4% 1,950 1,556 25.3% $408 380 7.4%
MDC
Holdings
1,647 1,481 11.2% 1,272 1,126 13.0% $448 410 9.3%
M/I
Homes
1,354 1,100 23.1% 1,042 919 13.4% $362 340 6.5%
SubTotal 32,220 29,357 9.8% 28,204 24,788 13.8% $354 $340 4.0%


from Calculated Risk http://ift.tt/2aQlgU3
via YQ Matrix

Chicago PMI declines in July, Final July Consumer Sentiment at 90.0

Chicago PMI: July Chicago Business Barometer Down 1 Point to 55.8
The MNI Chicago Business Barometer fell 1 point to 55.8 in July from the 1½-year high of 56.8 in June, led by a fall in New Orders. Smaller declines were seen in Production and Order Backlogs, which offset a strong increase in the Employment component.

The Barometer’s three-month average, though, which provides a better picture of the underlying trend in economic activity, rose to 54.0 from 52.2 in Q2, the highest since February 2015.
...
“Demand and output softened somewhat in July following a solid showing in June but still outperformed the very weak results seen earlier in the year. On the upside, it was the first time since January 2015 that all five Barometer components were above 50. Looking at the three-month average, the Chicago Business Barometer so far suggests economic activity running at a healthier pace in Q3,” said Lorena Castellanos, senior economist at MNI Indicators.
emphasis added
This was above the consensus forecast of 54.0.

Consumer Sentiment
Click on graph for larger image.

The final University of Michigan consumer sentiment index for July was at 90.0, up from the preliminary reading 89.5, and down from 93.5 in June. Read more at http://ift.tt/2aCn6eN:
"Although confidence strengthened in late July, for the month as a whole the Sentiment Index was still below last month's level mainly due to increased concerns about economic prospects among upper income households. The Brexit vote was spontaneously mentioned by record numbers of households with incomes in the top third (23%), more than twice as frequently as among households with incomes in the bottom two-thirds (11%). Given the prompt rebound in stock prices as well as the tiny direct impact on U.S. trade, it is surprising that concerns about Brexit remained nearly as high in late July as immediately following the Brexit vote. While concerns about Brexit are likely to quickly recede, weaker prospects for the economy are likely to remain. Uncertainties surrounding global economic prospects and the presidential election will keep consumers more cautious in their expectations for future economic growth. "
emphasis added


from Calculated Risk http://ift.tt/2aBJuVR
via YQ Matrix

BEA: Real GDP increased at 1.2% Annualized Rate in Q2

From the BEA: Gross Domestic Product: Second Quarter 2016 (Advance Estimate)
Real gross domestic product increased at an annual rate of 1.2 percent in the second quarter of 2016, according to the "advance" estimate released by the Bureau of Economic Analysis. In the first quarter, real GDP increased 0.8 percent (revised).
...
The increase in real GDP in the second quarter reflected positive contributions from personal consumption expenditures (PCE) and exports that were partly offset by negative contributions from private inventory investment, nonresidential fixed investment, residential fixed investment, and state and local government spending. Imports, which are a subtraction in the calculation of GDP, decreased.

The acceleration in real GDP growth in the second quarter reflected an acceleration in PCE, an upturn in exports, and smaller decreases in nonresidential fixed investment and in federal government spending. These were partly offset by a larger decrease in private inventory investment, and downturns in residential fixed investment and in state and local government spending.
emphasis added
The advance Q1 GDP report, with 1.2% annualized growth, was below expectations of a 2.6% increase.

Personal consumption expenditures (PCE) increased at a 4.2% annualized rate in Q2, up from 1.6% in Q1.   Residential investment (RI) decreased at a 6.1% pace. Equipment investment decreased at a 3.5% annualized rate, and investment in non-residential structures decreased at a 7.9% pace (due to the recent decline in oil prices).

The key negatives were investment in inventories (subtracted 1.16 percentage points), fixed investment (subtracted 0.52 percentage point), and government spending (subtracted 0.16 percentage points).

I'll have more later ...

from Calculated Risk http://ift.tt/2aitv9t
via YQ Matrix

Price Briefing 22-29 July 2016

Existing inventory in brown fused alumina prevented prices gain amid supply tightness; Chinese TiO2 producers announced eighth price hike; fertiliser prices expected to remain low in 2016 while fluorspar prices held at five-year lows as supply far outstripped demand.

from MPW - Pricing News http://ift.tt/2aeK6wK
via IFTTT

Competition sees cheaper fluorspar offers

As summer kicks in, market participants told IM that intensifying competition in a has pushed severe price undercutting in the market as producers aim to get rid of the stockpiles.

from MPW - Pricing News http://ift.tt/2avBeDX
via IFTTT

Stiffening competition sees fluorspar price divergence

As summer kicks in, market participants told IM that intensifying competition in a has pushed severe price undercutting in the market as producers aim to get rid of the stockpiles.

from MPW - Pricing News http://ift.tt/2agCo4A
via IFTTT

Thursday 28 July 2016

Zillow Forecast: Expect slightly slower YoY Growth in June for the Case-Shiller Indexes

The Case-Shiller house price indexes for May were released Tuesday. Zillow forecasts Case-Shiller a month early, and I like to check the Zillow forecasts since they have been pretty close.

From Zillow: June Case-Shiller Forecast: Expect a Third Straight Monthly Decline in 10- and 20-City Indices
May Case-Shiller data showed modestly slower growth largely in line with expectations, with seasonally adjusted home prices falling for two months in a row on the 10- and 20-city indices – a rare occurrence since the recovery began in earnest. Looking ahead, Zillow’s June Case-Shiller forecast calls for more of the same, with seasonally adjusted prices in the 10- and 20-city indices set to fall for a third straight month, while annual growth stays largely flat.

The June Case-Shiller National Index is expected to grow 5.1 percent year-over-year and 0.2 percent month-to-month (seasonally adjusted). We expect the 10-City Index to grow 4.1 percent year-over-year and to fall 0.2 percent (SA) from May. The 20-City Index is expected to grow 5 percent between June 2015 and June 2016, and fall 0.1 percent (SA) from May.

Zillow’s June Case-Shiller forecast is shown in the table below. These forecasts are based on today’s May Case-Shiller data release and the June 2016 Zillow Home Value Index (ZHVI). The June Case-Shiller Composite Home Price Indices will not be officially released until Tuesday, August 30.
The year-over-year change for the 20-city index will probably be slightly lower in the June report than in the May report.  The change for the National index will probably be about the same.

Zillow forecast for Case-Shiller

from Calculated Risk http://ift.tt/2ahHe3E
via YQ Matrix

Anti-pollution efforts cut BFA supply in China

The recent stricter anti-pollution checks in brown fused alumina producing regions in China are showing no sign of easing with production continuing to be impacted. While prices have not gained this week on tighter supply, market participants said it could rise when existing stock runs out.

from MPW - Pricing News http://ift.tt/2aqBV33
via IFTTT

Lithium carbonate, hydroxide spot prices steady

The decline in Chinese spot prices appears to have stalled this past week following several weeks of declines. Prices remain at historically high levels though with market participants continuing to report strong supply-demand fundamentals.

from MPW - Pricing News http://ift.tt/2aMUyeV
via IFTTT

Wednesday 27 July 2016

FOMC Statement: No Change to Policy, Upgrade Economy, Risk "diminished"

FOMC Statement:
Information received since the Federal Open Market Committee met in June indicates that the labor market strengthened and that economic activity has been expanding at a moderate rate. Job gains were strong in June following weak growth in May. On balance, payrolls and other labor market indicators point to some increase in labor utilization in recent months. Household spending has been growing strongly but business fixed investment has been soft. Inflation has continued to run below the Committee's 2 percent longer-run objective, partly reflecting earlier declines in energy prices and in prices of non-energy imports. Market-based measures of inflation compensation remain low; most survey-based measures of longer-term inflation expectations are little changed, on balance, in recent months.

Consistent with its statutory mandate, the Committee seeks to foster maximum employment and price stability. The Committee currently expects that, with gradual adjustments in the stance of monetary policy, economic activity will expand at a moderate pace and labor market indicators will strengthen. Inflation is expected to remain low in the near term, in part because of earlier declines in energy prices, but to rise to 2 percent over the medium term as the transitory effects of past declines in energy and import prices dissipate and the labor market strengthens further. Near-term risks to the economic outlook have diminished. The Committee continues to closely monitor inflation indicators and global economic and financial developments.

Against this backdrop, the Committee decided to maintain the target range for the federal funds rate at 1/4 to 1/2 percent. The stance of monetary policy remains accommodative, thereby supporting further improvement in labor market conditions and a return to 2 percent inflation.

In determining the timing and size of future adjustments to the target range for the federal funds rate, the Committee will assess realized and expected economic conditions relative to its objectives of maximum employment and 2 percent inflation. This assessment will take into account a wide range of information, including measures of labor market conditions, indicators of inflation pressures and inflation expectations, and readings on financial and international developments. In light of the current shortfall of inflation from 2 percent, the Committee will carefully monitor actual and expected progress toward its inflation goal. The Committee expects that economic conditions will evolve in a manner that will warrant only gradual increases in the federal funds rate; the federal funds rate is likely to remain, for some time, below levels that are expected to prevail in the longer run. However, the actual path of the federal funds rate will depend on the economic outlook as informed by incoming data.

The Committee is maintaining its existing policy of reinvesting principal payments from its holdings of agency debt and agency mortgage-backed securities in agency mortgage-backed securities and of rolling over maturing Treasury securities at auction, and it anticipates doing so until normalization of the level of the federal funds rate is well under way. This policy, by keeping the Committee's holdings of longer-term securities at sizable levels, should help maintain accommodative financial conditions.

Voting for the FOMC monetary policy action were: Janet L. Yellen, Chair; William C. Dudley, Vice Chairman; Lael Brainard; James Bullard; Stanley Fischer; Loretta J. Mester; Jerome H. Powell; Eric Rosengren; and Daniel K. Tarullo. Voting against the action was Esther L. George, who preferred at this meeting to raise the target range for the federal funds rate to 1/2 to 3/4 percent. emphasis added


from Calculated Risk http://ift.tt/2aKF76S
via YQ Matrix

Tuesday 26 July 2016

Periscope Letter Protesting Arizona RFP Eye Opening

At the end of this post, you will find a copy of a letter dated July 20th, 2016 from Periscope Holdings Inc. CEO Brian Utley, under the heading Protest of Solicitation No. ADSPO17-00006413; Electronic Procurement Solution.

Periscope is challenging the State of Arizona’s decision to issue an RFP for an “Electronic Procurement Solution.” Here is the link to the State’s Bid Solicitation; http://ift.tt/2afdS6q

Over the coming weeks, I will delve deeper into the letter’s contents, and what it means relative to Arizona’s desire to look for an alternative to Periscope’s BuySpeed offering. It should be noted that Arizona has been using the BuySpeed platform since 2009.

However, and while I want to stress that I have considerably more research to do, after a preliminary read of Mr. Utley’s letter, I will share with you my initial or gut reaction.

What Goes Around . . .?

To start, I could not believe what I was reading . . . is this the same Periscope who tried to leverage their relationship with the NIGP to challenge the Missouri contract award? In this regard, points 1 and 2 of Mr. Utley’s letter in particular, jump off the page.

By the way, you can read my coverage of the Periscope NIGP #CodeGate story through the following link; NIGP #CodeGate.

The two posts you will want to initially focus on are December 11th, 2014 – Up Periscope? Examining Periscope’s acquisition of BidSync with a “Survivor’s” eye and, March 31st, 2015 – Periscope Protest Letter Highlights Their Reasons For Challenging Missouri Selection of Perfect Commerce.

Private Versus Public Sector

I do not believe that this kind of protest would wash with a private sector client.

I am not talking about the actual process itself, or for that matter whether or not a vendor would have the right to protest the issuance of an RFP. What I am talking about is the business sense to pursue this course of action.

Besides sounding like sour grapes, the letter comes across as a company trying to bully a state into using their solution. It is as if Periscope doesn’t (or doesn’t want to) recognize the right or expertise of the state’s procurement people to make decisions or pursue courses of action that they feel is in the best interest of the state as opposed to the vendor’s.

Am I missing something here?

An Absence Of Arrogance

Although I have never really encountered a situation in which a vendor challenged the actual issuance of an RFP before now, the tone of the letter seems to be void of the usual vendor arrogance. Specifically the palpable, underlying sense that the vendor believes they know what is best for a public sector entity.

I can’t quite put my finger on it at this point, but there is definitely something different here. Makes one wonder how well Periscope has done in terms of both landing and maintaining new clients, and what the loss of Arizona would potentially mean to the company’s future prospects.

Periscope Final Bid Protest

In Conclusion . . . 

There are of course other elements to this story that are just now starting to come through, but at this point, this is my take.

Stay tuned for more updates.

In the meantime, here is the Periscope protest letter:


30


from Procurement Insights http://ift.tt/2a7Fk49
This content was assembled for you by the YQ Matrix platform

The views expressed in this post and throughout the series are the autor's own and not intended to reflect the views the YQ Matrix platform, its users or any associated organisations.

For the procurement people among you, have a look at the latest YQ Matrix raw material and semi-finished prices. For: Prices on other websites.

Real Prices and Price-to-Rent Ratio in May

Here is the earlier post on Case-Shiller: Case-Shiller: National House Price Index increased 5.0% year-over-year in May

The year-over-year increase in prices is mostly moving sideways now around 5%. In May, the index was up 5.0% YoY.

In the earlier post, I graphed nominal house prices, but it is also important to look at prices in real terms (inflation adjusted).  Case-Shiller, CoreLogic and others report nominal house prices.  As an example, if a house price was $200,000 in January 2000, the price would be close to $275,000 today adjusted for inflation (37%).  That is why the second graph below is important - this shows "real" prices (adjusted for inflation).

It has been almost ten years since the bubble peak.  In the Case-Shiller release this morning, the National Index was reported as being 2.8% below the bubble peak.   However, in real terms, the National index is still about 17.1% below the bubble peak.

Nominal House Prices


Nominal House PricesThe first graph shows the monthly Case-Shiller National Index SA, the monthly Case-Shiller Composite 20 SA, and the CoreLogic House Price Indexes (through May) in nominal terms as reported.

In nominal terms, the Case-Shiller National index (SA) is back to November 2005 levels, and the Case-Shiller Composite 20 Index (SA) is back to June 2005 levels, and the CoreLogic index (NSA) is back to June 2005.

Real House Prices

Real House PricesThe second graph shows the same three indexes in real terms (adjusted for inflation using CPI less Shelter). Note: some people use other inflation measures to adjust for real prices.

CPI less Shelter has declined over the last two years pushing up real house prices.

In real terms, the National index is back to January 2004 levels, the Composite 20 index is back to October 2003, and the CoreLogic index back to November 2003.

In real terms, house prices are back to late 2003 levels.

Price-to-Rent

In October 2004, Fed economist John Krainer and researcher Chishen Wei wrote a Fed letter on price to rent ratios: House Prices and Fundamental Value. Kainer and Wei presented a price-to-rent ratio using the OFHEO house price index and the Owners' Equivalent Rent (OER) from the BLS.

Price-to-Rent RatioHere is a similar graph using the Case-Shiller National, Composite 20 and CoreLogic House Price Indexes.

This graph shows the price to rent ratio (January 1998 = 1.0).

On a price-to-rent basis, the Case-Shiller National index is back to July 2003 levels, the Composite 20 index is back to June 2003 levels, and the CoreLogic index is back toMay 2003.

In real terms, and as a price-to-rent ratio, prices are back to late 2003  - and the price-to-rent ratio maybe moving a little more sideways now.

from Calculated Risk http://ift.tt/2a5cOiN
via YQ Matrix

Sweetgreen Makes Healthful Fast Food — But Can You Afford It?


By ANAHAD O'CONNOR from NYT Health http://ift.tt/2a2zkYR
This content was assembled for you by the YQ Matrix platform

The views expressed in this post and throughout the series are the autor's own and not intended to reflect the views the YQ Matrix platform, its users or any associated organisations.

For the procurement people among you, have a look at the latest YQ Matrix raw material and semi-finished prices. For: Prices on other websites.

Lithium export data shows China hydroxide price dip in June

The drop off in the spot price of lithium in China can be seen in lithium hydroxide export figures for June, though lithium carbonate retained its upward trajectory during the month, according to trade statistics recently released by the Chinese government.

from MPW - Pricing News http://ift.tt/2a7cy3P
via IFTTT

ICL concludes 700,000 tonne potash agreement with China

Tel Aviv-heaquartered ICL has finalised several supply contracts with Chinese buyers for the rest of 2016 at selling prices in line with other recently-signed fertiliser supply agreements.

from MPW - Pricing News http://ift.tt/2aHLGXL
via IFTTT

Separating Requirements From Preferences In Procurement Job Descriptions

Special thanks to Charles Dominick, SPSM3 of the Next Level Purchasing Association for this guest post.

Improving procurement capability can be accomplished in a variety of ways.  I prefer to focus on the people side of procurement capability.

Believe it or not, there is a single document at the foundation of the people side of procurement capability that determines the degree of success the organization will or will not achieve through its procurement people.

What is that document?

It is the job description.

Each procurement position needs a job description.  If you get it right, it will provide a solid foundation for attracting and keeping the right people.  If you get it wrong, it is like a thin, wet, ripped card at the bottom of a house of cards – it will lead to the whole house of cards falling.  Or, in less metaphorical terms, poor job descriptions will make it extremely difficult for you to achieve world-class procurement results for any sustained period of time.

A fundamental aspect of getting your procurement job descriptions right is carefully separating your requirements from your preferences.

When you think about your ideal candidate, you may think of someone with a masters’ degree from an Ivy League university, experience getting results in exactly the category of purchased goods or services to which you’d assign her, every procurement certification available, and an inspiring personality.  It’s good to think big.  Seldom do people who achieve big dreams not dream even bigger.

But when you write the job description you use to recruit your next procurement professional, you may want to be cautious against getting too dreamy.

Charles Prioritizing soft skills

If you required that candidates have the aforementioned education, experience, certifications, and personality, there may be only a handful of people – or less – in the world who can meet those qualifications.  And they may already be happily employed.  Or living on another continent.  Or expecting compensation three times what you’d be able to pay.

You obviously don’t want every Tom, Dick and Harry applying for your open strategic procurement position.  But you want to cast a wide enough net to give yourself some choice.

So, you may not want your job description to state that qualifications like that Ivy League MBA is “required.”  Instead, you may want to express the qualification as “preferred.”  This may encourage a candidate with the right experience, all of the certifications, and the right personality but only a bachelor’s degree from Harvard to apply whereas they would otherwise be discouraged from applying due to the master’s degree “requirement.”

So, think through all of the qualifications you value and determine if they are truly “required” or if you can consider them “preferred” so that you don’t have to turn away a rock star of a candidate due to a technicality.

In the next post in this series, I’ll share some insights on recruiting candidates that not only have the right qualifications, but are also truly serious about procurement.  Stay tuned!

30


from Procurement Insights http://ift.tt/2aaXFLP
This content was assembled for you by the YQ Matrix platform

The views expressed in this post and throughout the series are the autor's own and not intended to reflect the views the YQ Matrix platform, its users or any associated organisations.

For the procurement people among you, have a look at the latest YQ Matrix raw material and semi-finished prices. For: Prices on other websites.

Case-Shiller: National House Price Index increased 5.0% year-over-year in May

S&P/Case-Shiller released the monthly Home Price Indices for May ("May" is a 3 month average of March, April and May prices).

This release includes prices for 20 individual cities, two composite indices (for 10 cities and 20 cities) and the monthly National index.

Note: Case-Shiller reports Not Seasonally Adjusted (NSA), I use the SA data for the graphs.

From S&P: Home Price Increases Ease in May According to the S&P Corelogic Case-Shiller Indices
The S&P CoreLogic Case-Shiller U.S. National Home Price NSA Index, covering all nine U.S. census divisions, reported a 5.0% annual gain in May, the same as the prior month. The 10-City Composite posted a 4.4% annual increase, down from 4.7% the previous month. The 20-City Composite reported a year-over-year gain of 5.2%, down from 5.4% in April.
...
Before seasonal adjustment, the National Index posted a month-over-month gain of 1.2% in May. The 10-City Composite recorded a 0.8% month-over-month increase, while the 20-City Composite posted a 0.9% increase in May. After seasonal adjustment, the National Index recorded a 0.2% month-over month increase, the 10-City Composite posted a 0.2% decrease, and the 20-City Composite reported a 0.1% month-over-month decrease. After seasonal adjustment, 12 cities saw prices rise, two cities were unchanged, and six cities experienced negative monthly prices changes.
emphasis added
Case-Shiller House Prices Indices Click on graph for larger image.

The first graph shows the nominal seasonally adjusted Composite 10, Composite 20 and National indices (the Composite 20 was started in January 2000).

The Composite 10 index is off 10.9% from the peak, and down 0.2% in May (SA).

The Composite 20 index is off 9.0% from the peak, and down 0.1% (SA) in May.

The National index is off 2.8% from the peak, and up 0.2% (SA) in May.  The National index is up 31.3% from the post-bubble low set in December 2011 (SA).

Case-Shiller House Prices Indices The second graph shows the Year over year change in all three indices.

The Composite 10 SA is up 4.4% compared to May 2015.

The Composite 20 SA is up 5.2% year-over-year..

The National index SA is up 5.0% year-over-year.

Note: According to the data, prices increased in 12 of 20 cities month-over-month seasonally adjusted.

I'll have more later.

from Calculated Risk http://ift.tt/2a1UnuF
via YQ Matrix

Monday 25 July 2016

Tuesday: New Home Sales, Case-Shiller House Prices

Tuesday:
• At 9:00 AM ET, S&P/Case-Shiller House Price Index for May. Although this is the May report, it is really a 3 month average of March, April and May prices. The consensus is for a 5.6% year-over-year increase in the Comp 20 index for May. The Zillow forecast is for the National Index to increase 5.0% year-over-year in May.

• At 10:00 AM, New Home Sales for June from the Census Bureau. The consensus is for an increase in sales to 562 thousand Seasonally Adjusted Annual Rate (SAAR) in June from 551 thousand in May.

• Also at 10:00 AM, the Richmond Fed Survey of Manufacturing Activity for July.

From Matthew Graham at Mortgage News Daily: Mortgage Rates Continue Sideways Slide Ahead of Fed
Mortgage rates were unchanged again today, making three out of the past 4 days where rates haven't budged and 6 out of the past 7 days where rates moved by 0.01% or less, on average. That's an exceptionally narrow range, and it speaks to indecision in financial markets ahead of this week's major central bank announcements. That's where the Fed and the Bank of Japan give the official word on their monetary policy, which includes setting short term rates and spelling out various stimulus efforts.

The Fed isn't expected to hike rates this week, but chances increase as the year progresses. As such, it wouldn't be a surprise to see this week's announcement telegraph their intentions for the coming announcements. Although the Fed's policy rate does not directly control mortgage rates, there is typically upward pressure on all interest rates if Fed rate hike expectations increase.

In terms of specific levels, the average conventional 30yr fixed quote moved up to 3.5% for top tier scenarios late last week. Quite a few lenders are still quoting 3.375%, while just a few are up to 3.625%. Keep in mind, "top tier" means there are absolutely no "hits" to loan pricing (i.e. 25% equity, 760+ credit score, etc). Most loans in the real world have some hits (or adjustments to the 'perfect' pricing), meaning that a lot of 3.625-3.75% rates are being quoted. We track the top tier rate because that's the easiest way to capture the true day-over-day movement (especially considering the effect of certain adjustments has varied over time, and to some extent, between lenders).
emphasis added
Here is a table from Mortgage News Daily:


from Calculated Risk http://ift.tt/2a7dp8D
via YQ Matrix

Procurement Insights Moves Into Mainstream Media

With our final sponsorship commitments ending at the end of this month, Procurement Insights will be a 100 percent sponsor free blog.

While I have always striven to provide thorough and objective coverage, for me accepting blog sponsorship dollars didn’t seem to mesh with true journalism. Or as I would write in my post it is time for procurement to come of age,  any “appearance of favoritism or bias – even where none exists, is unacceptable.”

This is particularly important given the historically close ties between bloggers and the service providers they are covering. As we all know, the majority of the older blogs originated from within the provider community itself. Kudos to these “provider” blogs, as they were among the first to recognize the power of tapping into the emerging social media market.

In some ways, the first blogs are reminiscent of the shows that aired on television when that was a nascent medium.

Remember when there were only 2 or 3 channels to watch? Almost every show became a hit by virtue of a combination of both curiosity for the new medium, and limited selection?

Fast forward to today, and instead of 2 or 3 channels, there are hundreds. Instead of a handful of shows, there are an innumerable number of shows that are accessible 24/7. In short, and with an equally expanding choice for readers, blogs are faced with greater competition . . . and expectations.

This brings me back to why I made the decision to end this blog’s sponsorship program.

My readers and listeners are knowledgeable and sophisticated, and are increasingly tech savvy. In short, and in conjunction with the “commoditization” of procurement technology, you are looking for information and insights beyond a features, functions and benefits analysis. You want to know what makes a company tick. You want to know the people behind an organization – including their service capability and true client results. To do this effectively, I have to cover the industry in an entirely different way. This means that I will on occasion, have to scrutinize the companies I cover in ways that could be difficult to do, if I were dependent on their favor in terms of revenue and other incentives.

Or to put it another way, independence and objectivity go hand-in-hand. As we learned from the Theranos scandal, it is hard to have one without the other.

Now that this initial transition phase has been completed, I am ready to take this blog to a new level . . . mainstream media.

Starting with the Delaware Online News Journal’s coverage of the brewing legal battle between the State of Delaware and SciQuest, I will be expanding the scope of this blog through a collaborative coverage platform. This means that among other things, Procurement Insights will have permission to reprint articles from mainstream media publications in their entirety. It should be noted that Delaware Online is part of the USA Today Network.

It also means that where it makes sense, there will be shared research and collaboration on stories. This will provide you, my readers, with a broader news scope that includes perspectives on stories from those outside of the industry.

Over the coming month’s we will be announcing new collaborative engagements, as well as a tie-in to my radio show on Blog Talk Radio.

All-in-all, this is a an exciting time in that objective coverage of our industry that is unencumbered by financial ties and revenue dependence, is long overdue.

Furthermore, a collaborative coverage platform in which mainstream media can access resources and industry insights that may not have been previously possible, will elevate procurement’s profile to a larger and more general audience.

Mainstream Media2

30


from Procurement Insights http://ift.tt/2aorfS4
This content was assembled for you by the YQ Matrix platform

The views expressed in this post and throughout the series are the autor's own and not intended to reflect the views the YQ Matrix platform, its users or any associated organisations.

For the procurement people among you, have a look at the latest YQ Matrix raw material and semi-finished prices. For: Prices on other websites.

FOMC Preview: No Rate Hike, Possibly Preparing for September Rate Hike

The FOMC will meet on Tuesday and Wednesday, and no change to policy is expected.

There will no economic projections released at this meeting, and there is no scheduled press conference by Fed Chair Janet Yellen (in the unlikely event there is a change to policy, Yellen will probably hold a press conference).

So the focus will be on the FOMC statement.

Here is the first paragraph from the April FOMC statement:
Information received since the Federal Open Market Committee met in March indicates that labor market conditions have improved further even as growth in economic activity appears to have slowed. Growth in household spending has moderated, although households' real income has risen at a solid rate and consumer sentiment remains high. Since the beginning of the year, the housing sector has improved further but business fixed investment and net exports have been soft. A range of recent indicators, including strong job gains, points to additional strengthening of the labor market. Inflation has continued to run below the Committee's 2 percent longer-run objective, partly reflecting earlier declines in energy prices and falling prices of non-energy imports. Market-based measures of inflation compensation remain low; survey-based measures of longer-term inflation expectations are little changed, on balance, in recent months.
emphasis added
And the first paragraph from the June FOMC statement:
Information received since the Federal Open Market Committee met in April indicates that the pace of improvement in the labor market has slowed while growth in economic activity appears to have picked up. Although the unemployment rate has declined, job gains have diminished. Growth in household spending has strengthened. Since the beginning of the year, the housing sector has continued to improve and the drag from net exports appears to have lessened, but business fixed investment has been soft. Inflation has continued to run below the Committee's 2 percent longer-run objective, partly reflecting earlier declines in energy prices and in prices of non-energy imports. Market-based measures of inflation compensation declined; most survey-based measures of longer-term inflation expectations are little changed, on balance, in recent months.
Since the June meeting, the economic data has been mostly positive, and the June employment report showed a gain of 287,000 jobs. The Q2 GDP report will be released on Friday, and is expected to show real GDP growth picked up in the second quarter.

The key for a possible September rate hike is if the first paragraph in the FOMC statement is more positive than in June. If the first sentence is changed to something like "Information received since the Federal Open Market Committee met in June indicates that labor market conditions have improved and growth in economic activity appears to have picked up", then the FOMC is probably preparing - if the improved data flow continues - to raise rates in September.

from Calculated Risk http://ift.tt/2a9ajhI
via YQ Matrix

Dallas Fed: Regional Manufacturing Activity "Stabilizes" in July

From the Dallas Fed: Texas Manufacturing Activity Stabilizes
Texas factory activity held steady in July, according to business executives responding to the Texas Manufacturing Outlook Survey. The production index, a key measure of state manufacturing conditions, came in near zero after two months of negative readings, suggesting output stopped falling this month.

Some other measures of current manufacturing activity also reflected stabilization, and demand declines abated somewhat. The capacity utilization and shipments indexes posted near-zero readings, up from negative territory in May and June. The new orders index rose six points to –8.0, while the growth rate of orders index rose nine points to –9.7.

Perceptions of broader business conditions were notably less pessimistic. While the general business activity index remained negative for a nineteenth month in a row, it jumped 17 points to –1.3 in July. The company outlook index also remained negative but rose, climbing from –11 to –2.3.

Labor market measures indicated slight employment declines and stable workweek length. The employment index came in at –2.6, up from a post-recession low of –11.5 last month. ...
emphasis added
Still difficult conditions in the Dallas region, but a little better than previous months.  The impact of lower oil prices is still impacting manufacturing.

from Calculated Risk http://ift.tt/2a0Eo0Q
via YQ Matrix

Titanium dioxide producers in China hike prices further

Titanium dioxide producers have announced the eighth round of price hikes in China, led by Sichuan Lomon.

from MPW - Pricing News http://ift.tt/2apZrLF
via IFTTT

Black Knight: House Price Index up 1.1% in May, Up 5.4% year-over-year

Note: I follow several house price indexes (Case-Shiller, CoreLogic, Black Knight, Zillow, FHFA, FNC and more). Note: Black Knight uses the current month closings only (not a three month average like Case-Shiller or a weighted average like CoreLogic), excludes short sales and REOs, and is not seasonally adjusted.

From Black Knight: Black Knight Home Price Index Report: May 2016 Transactions, U.S. Home Prices Up 1.1 Percent for the Month; Up 5.4 Percent Year-Over-Year
• U.S. home prices were up 1.1% for the month, and 5.4% from a year ago

• At $263K, the U.S. HPI is up nearly 32% from the bottom of the market at the start of 2012 and is now just 1.8% off its June 2006 peak

• 15 of the 40 largest metros hit new peaks:
◦Austin, TX ($303K)
◦Boston, MA ($424K)
◦Charlotte, NC ($209K)
◦Columbus, OH ($183K)
◦Dallas, TX ($234K)
◦Denver, CO ($357K)
◦Houston, TX ($227K)
◦Kansas City, MO ($182K)
◦Nashville, TN ($235K)
◦Pittsburgh, PA ($194K)
◦Portland, OR ($352K)
◦San Antonio, TX ($202K)
◦San Francisco, CA ($771K)
◦San Jose, CA ($920K)
◦Seattle, WA ($405K)
The year-over-year increase in this index has been about the same for the last year.

from Calculated Risk http://ift.tt/2aog2ma
via YQ Matrix

Sunday 24 July 2016

Sunday Night Futures

Weekend:
Schedule for Week of July 24, 2016

The Future is Still Bright!

Monday:
• At 10:30 AM ET: Dallas Fed Survey of Manufacturing Activity for July.

From CNBC: Pre-Market Data and Bloomberg futures: S&P and DOW futures are down slightly (fair value).

Oil prices were down over the last week with WTI futures at $44.26 per barrel and Brent at $45.69 per barrel.  A year ago, WTI was at $48, and Brent was at $54 - so prices are down 10% to 15% year-over-year.

Here is a graph from Gasbuddy.com for nationwide gasoline prices. Nationally prices are at $2.16 per gallon (down over $0.50 per gallon from a year ago).

from Calculated Risk http://ift.tt/2a4iw9t
via YQ Matrix

The Future is still Bright!

Three and a half years ago I wrote The Future's so Bright .... In that post I outlined why I was becoming more optimistic. It is time for another update!

For new readers: I was very bearish on the economy when I started this blog in 2005 - back then I wrote mostly about housing (see: LA Times article and more here for comments about the blog). I started looking for the sun in early 2009, and recently I've been more optimistic.

Here are some updates to the graphs I posted 3+ years ago.  Several of these graphs have changed direction since that original post.  As example, state and local government employment is now increasing, and household deleveraging is over (as predicted).

Total Housing Starts and Single Family Housing StartsClick on graph for larger image.

This graph shows total and single family housing starts. Even though starts are up about 150% from the bottom, starts are still below the average level of 1.5 million per year from 1959 through 2000.

Demographics and household formation suggests starts will increase to around 1.5 million over the next few years. That means starts will probably increase another 25% or so from the June 2016 level of 1.19 million starts (SAAR).

Residential investment and housing starts are usually the best leading indicator for the economy, so this suggests the economy will continue to grow.

State and Local GovernmentThis graph shows total state and government payroll employment since January 2007. State and local governments lost 129,000 jobs in 2009, 262,000 in 2010, 217,000 in 2011, and 40,000 in 2012.

Since January 2013, state and local employment has increased 259,000.

So, in the aggregate, state and local government layoffs are over - and the economic drag on the economy is over.  However state and local government employment is still 464,000 below the pre-recession peak.

US Federal Government Budget Surplus Deficit
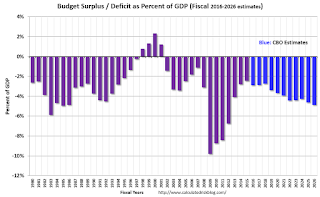
And here is a graph on the US deficit. This graph, based on the CBO's recent projections, shows the actual (purple) budget deficit each year as a percent of GDP, and an estimate for the next ten years based on estimates from the CBO.

As we've been discussing, the US deficit as a percent of GDP declined significantly over the last few years, and will probably remain under 3% for several years.  

Here are a couple of graph on household debt (and debt service):

Total Household DebtThis graph from the the NY Fed shows aggregate household debt has increased over the last 3 years.

From the NY Fed: Household Debt Steps Up, Delinquencies Drop
Household indebtedness continued to advance during the first three months of 2016 according to the Federal Reserve Bank of New York’s Quarterly Report on Household Debt and Credit,  ...
...
"Delinquency rates and the overall quality of outstanding debt continue to improve," said Wilbert van der Klaauw, senior vice president at the New York Fed. "The proportion of overall debt that becomes newly delinquent has been on a steady downward trend and is at its lowest level since our series began in 1999. This improvement is in large part driven by mortgages."
emphasis added
There will be a little more deleveraging ahead for certain households (mostly from foreclosures and distressed sales), but in the aggregate, household deleveraging ended almost 3 years ago.

Financial ObligationsThis graph is from the Fed's Household Debt Service and Financial Obligations Ratios. These ratios show the percent of disposable personal income (DPI) dedicated to debt service (DSR) and financial obligations (FOR) for households.

The overall Debt Service Ratio has been moving sideways and is near the record low.  Note: The financial obligation ratio (FOR) is also near a record low  (not shown)

Also the DSR for mortgages (blue) are near the low for the last 30 years.  This ratio increased rapidly during the housing bubble, and continued to increase until 2007. With falling interest rates, and less mortgage debt (mostly due to foreclosures), the mortgage ratio has declined significantly.

This data suggests household cash flow is in much better shape than several years ago.

AIA Architecture Billing IndexAnd for commercial real estate, here is the AIA Architecture Billings Index. This is usually a leading indicator for commercial real estate, and the readings over the last year suggest more increases in CRE investment at least through mid-2017 (except oil and power with the recent decline in oil prices).

Overall it appears the economy is poised for more growth.

And in the longer term I remain very optimistic.

In 2014, I posted some demographic data for the U.S., see: Census Bureau: Largest 5-year Population Cohort is now the "20 to 24" Age Group.

I pointed out that "even without the financial crisis we would have expected some slowdown in growth this decade (just based on demographics). The good news is that will change soon."

Changes in demographics are an important determinant of economic growth, and although most people focus on the aging of the "baby boomer" generation, the movement of younger cohorts into the prime working age is another key story in coming years. Here is a graph of the prime working age population (this is population, not the labor force) from 1948 through June 2016.

Prime Working Age PopulatonThere was a huge surge in the prime working age population in the '70s, '80s and '90s.  The prime working age population peaked in 2007, and bottomed at the end of 2012, and is almost back to the previous peak (this has nothing to do with the recession - just demographics).

The good news is the prime working age group has started to grow again, and should be growing solidly by 2020 - and this should boost economic activity in the years ahead.

These young workers are well educated and tech savvy.  And they will have babies and buy homes soon.  For more, see from Joe Weisenthal: The Analyst Who Nailed The Housing Crash Is Quietly Revealing The Next Big Thing

And a couple of graphs from The Projected Improvement in Life Expectancy

Instead of look at life expectancy, here is a graph of survivors out of 100,000 born alive, by age for three groups: those born in 1900-1902, born in 1949-1951 (baby boomers), and born in 2010.

SurvivorsThere was a dramatic change between those born in 1900 (blue) and those born mid-century (orange). The risk of infant and early childhood deaths dropped sharply, and the risk of death in the prime working years also declined significantly.

The CDC is projecting further improvement for childhood and prime working age for those born in 2010, but they are also projecting that people will live longer.

Death by AgeThe second graph uses the same data but looks at the number of people who die before a certain age, but after the previous age. As an example, for those born in 1900 (blue), 12,448 of the 100,000 born alive died before age 1, and another 5,748 died between age 1 and age 5.  That is 18.2% of those born in 1900 died before age 5.

In 1950, only 3.5% died before age 5.  In 2010, it was 0.7%.

The peak age for deaths didn't change much for those born in 1900 and 1950 (between 76 and 80, but many more people born in 1950 will make it).

Now the CDC is projection the peak age for deaths - for those born in 2010 - will increase to 86 to 90!

Also the number of deaths for those younger than 20 will be very small (down to mostly accidents, guns, and drugs).  Self-driving cars might reduce the accident components of young deaths.

In 1900, 25,2% died before age 20.  And another 26.8% died before 55.

In 1950, 5.3% died before age 20.  And another 18.7% died before 55.  A dramatic decline in early deaths.

In 2010, 1.5% are projected to die before age 20.  And only 9.7% before 55.  A dramatic decline in prime working age deaths.

An amazing statistic: for those born in 1900, about 13 out of 100,000 made it to 100.  For those born in 1950, 199 are projected to make to 100 - an significant increase.   Now the CDC is projecting that 1,968 out of 100,000 born in 2010 will make it to 100.  Stunning!

Some people look at this data and worry about supporting all the old people.  To me, this is all great news - the vast majority of people can look forward to a long life - with fewer people dying in childhood or during their prime working years.  Awesome!

Three and a half years ago I said that looking forward I was the most optimistic since the '90s. And things are only getting better. The future's so bright, I gotta wear shades.

Yes, the song was about nuclear holocaust ... but it was originally intended the way I'm using it.

from Calculated Risk http://ift.tt/2a5esjb
via YQ Matrix

Saturday 23 July 2016

Aeropostale Accuses Sycamore Partners of 'Loan to Own' Scheme


By REUTERS from NYT Business Day http://ift.tt/2a8dN4a
This content was assembled for you by the YQ Matrix platform

The views expressed in this post and throughout the series are the autor's own and not intended to reflect the views the YQ Matrix platform, its users or any associated organisations.

For the procurement people among you, have a look at the latest YQ Matrix raw material and semi-finished prices. For: Prices on other websites.

Schedule for Week of July 24, 2016

The key reports this week are the first estimate of Q2 GDP, June New Home sales, and the Case-Shiller House Price Index for May.

The FOMC is meeting on Tuesday and Wednesday, and no change in policy is expected this week.

For manufacturing, the July Dallas, Richmond and Kansas City manufacturing surveys will be released this week.

----- Monday, July 25th -----

10:30 AM ET: Dallas Fed Survey of Manufacturing Activity for July.

----- Tuesday, July 26th -----

Case-Shiller House Prices Indices9:00 AM: S&P/Case-Shiller House Price Index for May. Although this is the May report, it is really a 3 month average of March, April and May prices.

This graph shows the nominal seasonally adjusted National Index, Composite 10 and Composite 20 indexes through the April 2016 report (the Composite 20 was started in January 2000).

The consensus is for a 5.6% year-over-year increase in the Comp 20 index for May. The Zillow forecast is for the National Index to increase 5.0% year-over-year in May.

New Home Sales10:00 AM ET: New Home Sales for June from the Census Bureau.

This graph shows New Home Sales since 1963. The dashed line is the May sales rate.

The consensus is for an increase in sales to 562 thousand Seasonally Adjusted Annual Rate (SAAR) in June from 551 thousand in May.

10:00 AM: Richmond Fed Survey of Manufacturing Activity for July. .

----- Wednesday, July 27th -----

7:00 AM ET: The Mortgage Bankers Association (MBA) will release the results for the mortgage purchase applications index.

8:30 AM: Durable Goods Orders for May from the Census Bureau. The consensus is for a 1.3% decrease in durable goods orders.

10:00 AM: Pending Home Sales Index for June. The consensus is for a 1.3% increase in the index.

2:00 PM: FOMC Meeting Announcement. No change in policy is expected at this meeting.

----- Thursday, July 28th -----

8:30 AM ET: The initial weekly unemployment claims report will be released.  The consensus is for 264 thousand initial claims, up from 253 thousand the previous week.

10:00 AM: the Q2 Housing Vacancies and Homeownership from the Census Bureau.

11:00 AM: Kansas City Fed Survey of Manufacturing Activity for July.  This is the last of the regional Fed surveys for July.

----- Friday, July 29th -----

8:30 AM ET: Gross Domestic Product, 2nd quarter 2016 (Advance estimate). The consensus is that real GDP increased 2.6% annualized in Q2. The annual revision will also be released.

9:45 AM: Chicago Purchasing Managers Index for July. The consensus is for a reading of 54.0, down from 56.8 in June.

10:00 AM: University of Michigan's Consumer sentiment index (final for July). The consensus is for a reading of 90.6, up from the preliminary reading 89.5, and down from 93.5 in June.

from Calculated Risk http://ift.tt/2ajf36W
via YQ Matrix