Friday 30 October 2015

Restaurant Performance Index indicates slower expansion in September

Here is a minor indicator I follow from the National Restaurant Association: Restaurant Performance Index: Operators’ Sales Outlook at Two-Year Low
Although same-store sales and customer traffic remained positive in September, the National Restaurant Association’s Restaurant Performance Index (RPI) registered a modest decline. The RPI – a monthly composite index that tracks the health of and outlook for the U.S. restaurant industry – stood at 101.4 in September, down slightly from a level of 101.5 in August. Despite the decline, September represented the 31st consecutive month in which the RPI stood above 100, which signifies expansion in the index of key industry indicators.
...
“The RPI's current situation indicators continued to illustrate growth in September, as both same-store sales and customer traffic remained positive,” said Hudson Riehle, senior vice president of the Research and Knowledge Group for the Association. “However, restaurant operators are more cautious about business conditions in the months ahead, as the proportion expecting a sales increase fell to a two-year low.”
emphasis added
Restaurant Performance Index Click on graph for larger image.

The index decreased to 101.4 in September, down from 101.5 in August. (above 100 indicates expansion).

Restaurant spending is discretionary, so even though this is "D-list" data, I like to check it every month.  Even with this decline, the index is indicating expansion, and it appears restaurants are benefiting from lower gasoline prices.

from Calculated Risk http://ift.tt/1Panoon
via YQ Matrix

Competition from coke hobbles amorphous graphite market

Weak demand and excess production in the amorphous graphite sector is being exacerbated by stiff competition from low-cost coke products.

from MPW - Pricing News http://ift.tt/1P1uFse
via IFTTT

BEA: Personal Income increased 0.1% in September, Core PCE prices up 1.3% year-over-year

From the BEA, the Personal Income and Outlays report for September:
Personal income increased $18.6 billion, or 0.1 percent ... in September, according to the Bureau of Economic Analysis.
...
Real PCE -- PCE adjusted to remove price changes -- increased 0.2 percent in September, compared with an increase of 0.4 percent in August. ... The price index for PCE decreased 0.1 percent in September, compared with a decrease of less than 0.1 percent in August. The PCE price index, excluding food and energy, increased 0.1 percent in September, the same increase as in August.

The September price index for PCE increased 0.2 percent from September a year ago. The September PCE price index, excluding food and energy, increased 1.3 percent from September a year ago.
On inflation: the PCE price index was up 0.2% year-over-year (the decline in oil prices pushed down the headline price index).  However core PCE is only up 1.3% year-over-year - still way below the Fed's target.

from Calculated Risk http://ift.tt/1OcIkfZ
via YQ Matrix

Thursday 29 October 2015

Friday: Personal Income and Outlays, Employment Cost Index, Chicago PMI, Consumer Sentiment

Earlier today, the UCLA Ziman Center for Real Estate released some predictions for 2016:
[W]e are forecasting housing starts of 1.14 million units this year and 1.42 million units and 1.44 million units in 2016 and 2017, respectively. ...

Our forecast is underpinned by continued growth in real GDP that will likely run at 3% in 2016, continued jobs gains in excess of 200,000 a month for most of the forecast period, relatively low mortgage rates at least through 2016 and household formations in excess of one million a year in 2016 and 2017.
This housing start forecast for 2016 seems way too optimistic and I doubt the builders could ramp up that quickly. Also I doubt we will see 200 thousand jobs added per month through 2017; it takes less that 100 thousand jobs per month to hold the unemployment rate steady - and I've been expecting job growth to slow.

Friday:
• At 8:30 AM ET, Personal Income and Outlays for September. The consensus is for a 0.2% increase in personal income, and for a 0.2% increase in personal spending. And for the Core PCE price index to increase 0.2%.

• Also at 8:30 AM, the Employment Cost Index for Q3. The consensus is for a 0.6% increase in Q3.

• At 9:45 AM, Chicago Purchasing Managers Index for October. The consensus is for a reading of 49.2, up from 48.7 in September.

• At 10:00 AM, University of Michigan's Consumer sentiment index (final for October). The consensus is for a reading of 92.5, up from the preliminary reading of 92.1.

from Calculated Risk http://ift.tt/1WkTcwG
via YQ Matrix

Zillow Forecast: Expect September Year-over-year Change for Case-Shiller Index Similar to August

The Case-Shiller house price indexes for August were released Tuesday. Zillow forecasts Case-Shiller a month early, and I like to check the Zillow forecasts since they have been pretty close.

From Zillow: September Case-Shiller Forecast: Look for Continued Modest Growth in Pace of Appreciation
he August S&P Case-Shiller (SPCS) data published [Tuesday] showed home prices rising on a seasonally-adjusted monthly basis, with slight rises in the 10- and 20- city indices and almost half a percentage point rise in the national index.

We expect the September SPCS to show similar slight increases of 0.1 percent for the 10-City Index and 0.2 percent for the 20-City Index from August to September. The national index is expected to gain half of a percentage point over the same period (seasonally adjusted). We expect the 10- City and national indices to both grow 4.7 percent for the year ending in September, and the 20-City Index to grow 5.1 percent, the same rates of annual appreciation reported for August.

All SPCS forecasts are shown in the table below. These forecasts are based on today’s August SPCS data release and the September 2015 Zillow Home Value Index (ZHVI), released October 26. The SPCS Composite Home Price Indices for September will not be officially released until Tuesday, November 24.
This suggests the year-over-year change for the September Case-Shiller National index will be about the same as in the August report.

Zillow Case-Shiller Forecast
  Case-Shiller
Composite 10
Case-Shiller
Composite 20
Case-Shiller
National
NSA SA NSA SA NSA SA
August
Actual YoY
4.7% 4.7% 5.1% 5.1% 4.7% 4.7%
September
Forecast
YoY
4.7% 4.7% 5.1% 5.1% 4.7% 4.7%
September
Forecast
MoM
-0.1% 0.1% -0.1% 0.2% 0.0% 0.5%


from Calculated Risk http://ift.tt/1Ob0nTw
via YQ Matrix

Lawler: Builders say Labor Shortages Delaying Closings, Pushing Up Costs; and Some Other Observations

From housing economist Tom Lawler:

Several builders have released earnings and had earnings conference calls for the quarter ended September 30, 2015, and one of the key “themes” from builders was that resource “constraints,” specifically with respect to labor, slowed home closings last quarter, and in some cases contributed to weaker than expected net orders. PulteGroup, M/I Homes, Meritage Homes, and MDC Holdings all said, in one form or another, that labor “shortages” – laborers, land development, and various trades – had resulted both in accelerating labor costs and delays in land development and home construction. Most builders said that the main impact in terms of their operating results were lower-than-expected home closings last quarter, though one said that in some markets longer construction timelines appear to have led some buyers to forgo a home purchase.

Most builders noted that both land and labor costs had increased “significantly” of late, though costs of most materials were down. Several of the builders said that they were “able” to increase prices to match increases in overall construction costs in most markets, though at least one builder implied that price hikes in a few markets where costs had increased significantly may have led to fewer home orders.

While only one builder – Meritage -- gave specific numbers on the intra-quarterly patterrn of net home orders last quarter, the numbers were startling. According to a Meritage official, the YOY % change in the company’s net orders was +22% in July and +8% in August, but -15% in September. The official wasn’t sure what prompted the sharp slowdown in home orders in September, but he said he was pretty sure other builders say the same drop-off in sales in September. (Earlier this week Census reported that its preliminary estimate of new home sales fell sharply on a seasonally adjusted basis from August to September.) He also said that based on preliminary numbers it appeared as if net home orders would be up 10 to 15% YOY in October.

Commentary on first-time buyers has been mixed. PultgGroup showed a chart suggesting that 33% of its home deliveries last quarter were to “first-time buyers,” but in response to a question (about prices) an official said that PulteGroup was not so much focused on “entry-level” fist-time buyers but more on “affluent” first-time buyers purchasing homes in the $300,000-$400,000 range. M/I Homes said that it was “watching” for signs that the entry-level home buyer market was improving, and that it would be “ready to respond,” but that at present it had no new product plants designed for that market. Officials did note, however, that in the early part of last decade it sold a “substantial” number of sub-2,000 square-foot homes.

Meritage Homes, in contrast, said that it had seen an improvement in the demand from first-time buyers, and that it planned to increase its offerings of smaller, lower price homes over the next year.

On of the more striking aspects of the most recent “recovery” in single-family housing production has been the incredible low production levels of new single-family homes that are “affordable” to what used to be considered the “typical” first-time buyer.

While builders with a presence in Houston for the most part have downplayed the severity of the weakness in the Houston housing markets, Meritage officials gave some intra-quarterly color that suggested the market had deteriorated significantly over the past few months. Specifically, officials said that company’s sales cancellation rate have “spiked up,” and that sales has fallen “significantly,” over the past 60 days.

Flipping back to the “substantial” increase in labor costs at home builders, the BLS data on average hourly earnings for construction workers (including those involved in building single-family homes) does not show the sort of increases builders are reporting. One would assume, however, that they will soon.

Here is a summary of some selected stats from builders who have reported results for the quarter ended September 30, 2015.

  Net Orders Settlements Average Closing
 Price ($000s)
Qtr. Ended: 9/15 9/14 % Chg 9/15 9/14 % Chg 9/15 9/14 % Chg
PulteGroup 4,092 3,779 8.3% 4,356 4,646 -6.2% $336,000 334,000 0.6%
NVR 3,258 2,936 11.0% 3,607 3,236 11.5% $380,400 366,200 3.9%
Meritage Homes 1,567 1,500 4.5% 1,712 1,522 12.5% $387,000 358,000 8.1%
MDC Holdings 1,109 1,081 2.6% 1,080 1,093 -1.2% $421,100 370,600 13.6%
M/I Homes 988 892 10.8% 994 985 0.9% $349,000 320,000 9.1%
Total 11,014 10,188 8.1% 11,749 11,482 2.3% $365,985 $348,539 5.0%


from Calculated Risk http://ift.tt/1LEKpxq
via YQ Matrix

Kelly Barner weighs in on the Bloggers Defence Fund, my coverage of industry events, and the $3.5 million lawsuit by Jon Hansen

Editor’s Note: In response to a $3.5 million lawsuit, late last week I officially launched the Bloggers Defence Fund. While I have just begun the process of reaching out to the community, I have received words of support from several people – including the message below from Buyers Meeting Point’s Kelly Barner. It was originally posted as a comment in the Buyers Meeting Point Group on LinkedIn.

charles-seymour-quotes2

We should not overestimate the importance of having a range of perspectives on any event – procurement or otherwise. I’ve been (perilously?) close to Jon’s research for the last year, and can speak to the time, energy, and careful thought that has gone into it. There is nothing haphazard, personal, or reckless about the coverage we read on Procurement Insights.

I don’t claim to be objective. Jon has been a friend and mentor for years. In that time he has never steered me wrong. He never exploited my ‘newness’ as a blogger. He also never seemed concerned that we might be competitors – not Buyers Meeting Point and Procurement Insights, and not any of the other blogs or news sites in procurement. He has always emphasized the need for more voices rather than less for the good of the profession as a whole. Sadly, not everyone agrees with that principle.

You may agree or disagree with the conclusions Jon has drawn from his research. You may question his willingness to make those ideas public or cringe at his decision not to back down in the face of the consequences.

Somebody has to be willing to ask the tough questions and shine a light on topics and practices that merit further consideration. I encourage the entire Buyers Meeting Point community to consider making a donation of any size to the Blogger’s Defence Fund: http://ift.tt/1RJRHStless

30


from Procurement Insights http://ift.tt/1im0aPh
This content was assembled for you by the YQ Matrix platform

The views expressed in this post and throughout the series are the autor's own and not intended to reflect the views the YQ Matrix platform, its users or any associated organisations.

For the procurement people among you, have a look at the latest YQ Matrix raw material and semi-finished prices. For: Prices on other websites.

BEA: Real GDP increased at 1.5% Annualized Rate in Q3

From the BEA: Gross Domestic Product: Third Quarter 2015 (Advance Estimate)
Real gross domestic product -- the value of the goods and services produced by the nation’s economy less the value of the goods and services used up in production, adjusted for price changes -- increased at an annual rate of 1.5 percent in the third quarter of 2015, according to the "advance" estimate released by the Bureau of Economic Analysis. In the second quarter, real GDP increased 3.9 percent.
...
The increase in real GDP in the third quarter primarily reflected positive contributions from personal consumption expenditures (PCE), state and local government spending, nonresidential fixed investment, exports, and residential fixed investment that were partly offset by negative contributions from private inventory investment. Imports, which are a subtraction in the calculation of GDP, increased.
emphasis added
The advance Q3 GDP report, with 1.5% annualized growth, was below expectations of a 1.7% increase.

Personal consumption expenditures (PCE) increased at a 3.2% annualized rate - a solid pace.   Residential investment (RI) increased at a 6.1% pace, and equipment investment at a 5.3% pace - both solid.  Domestic demand was solid.

The key negatives were investment in inventories (subtracted 1.44 percentage point) and investment in nonresidential structures (subtracted 0.11 percentage points).

I'll have more later ...

from Calculated Risk http://ift.tt/1OZYDwH
via YQ Matrix

Zircon prices disappoint predictions by slipping

Average prices fall by $10/tonne in weak market conditions, blamed on low Chinese demand.

from MPW - Pricing News http://ift.tt/1ilCSsD
via IFTTT

Index of Private Housing Rental Prices - July to September 2015 results

The Index of Private Housing Rental Prices (IPHRP) is a quarterly experimental price index. It tracks the prices paid for renting property from private landlords in Great Britain.

from Taxonomy RSS http://ift.tt/1LZld2H
via YQ Matrix

Index of Private Housing Rental Prices, July to September 2015

An experimental price index tracking the prices paid for renting property from private landlords in Great Britain.

from Taxonomy RSS http://ift.tt/1P7grVc
via YQ Matrix

Index of Private Housing Rental Prices, Reference Tables, September 2015

Rental price index historical time series.

from Taxonomy RSS http://ift.tt/20cfgc3
via YQ Matrix

Wednesday 28 October 2015

FOMC Statement: No Rate Hike

Less global concern. Slightly more positive. December still on table.

FOMC Statement:
Information received since the Federal Open Market Committee met in September suggests that economic activity has been expanding at a moderate pace. Household spending and business fixed investment have been increasing at solid rates in recent months, and the housing sector has improved further; however, net exports have been soft. The pace of job gains slowed and the unemployment rate held steady. Nonetheless, labor market indicators, on balance, show that underutilization of labor resources has diminished since early this year. Inflation has continued to run below the Committee's longer-run objective, partly reflecting declines in energy prices and in prices of non-energy imports. Market-based measures of inflation compensation moved slightly lower; survey-based measures of longer-term inflation expectations have remained stable.

Consistent with its statutory mandate, the Committee seeks to foster maximum employment and price stability. The Committee expects that, with appropriate policy accommodation, economic activity will expand at a moderate pace, with labor market indicators continuing to move toward levels the Committee judges consistent with its dual mandate. The Committee continues to see the risks to the outlook for economic activity and the labor market as nearly balanced but is monitoring global economic and financial developments. Inflation is anticipated to remain near its recent low level in the near term but the Committee expects inflation to rise gradually toward 2 percent over the medium term as the labor market improves further and the transitory effects of declines in energy and import prices dissipate. The Committee continues to monitor inflation developments closely.

To support continued progress toward maximum employment and price stability, the Committee today reaffirmed its view that the current 0 to 1/4 percent target range for the federal funds rate remains appropriate. In determining whether it will be appropriate to raise the target range at its next meeting, the Committee will assess progress--both realized and expected--toward its objectives of maximum employment and 2 percent inflation. This assessment will take into account a wide range of information, including measures of labor market conditions, indicators of inflation pressures and inflation expectations, and readings on financial and international developments. The Committee anticipates that it will be appropriate to raise the target range for the federal funds rate when it has seen some further improvement in the labor market and is reasonably confident that inflation will move back to its 2 percent objective over the medium term.

The Committee is maintaining its existing policy of reinvesting principal payments from its holdings of agency debt and agency mortgage-backed securities in agency mortgage-backed securities and of rolling over maturing Treasury securities at auction. This policy, by keeping the Committee's holdings of longer-term securities at sizable levels, should help maintain accommodative financial conditions.

When the Committee decides to begin to remove policy accommodation, it will take a balanced approach consistent with its longer-run goals of maximum employment and inflation of 2 percent. The Committee currently anticipates that, even after employment and inflation are near mandate-consistent levels, economic conditions may, for some time, warrant keeping the target federal funds rate below levels the Committee views as normal in the longer run.

Voting for the FOMC monetary policy action were: Janet L. Yellen, Chair; William C. Dudley, Vice Chairman; Lael Brainard; Charles L. Evans; Stanley Fischer; Dennis P. Lockhart; Jerome H. Powell; Daniel K. Tarullo; and John C. Williams. Voting against the action was Jeffrey M. Lacker, who preferred to raise the target range for the federal funds rate by 25 basis points at this meeting.
emphasis added


from Calculated Risk http://ift.tt/1jRJbGb
via YQ Matrix

Tuesday 27 October 2015

Real Prices and Price-to-Rent Ratio in August

Here is the earlier post on Case-Shiller: Case-Shiller: National House Price Index increased 4.7% year-over-year in August

The year-over-year increase in prices is mostly moving sideways now at between 4% and 5%.. In October 2013, the National index was up 10.9% year-over-year (YoY). In August 2015, the index was up 4.7% YoY.

Here is the YoY change since January 2014 for the National Index:

Month YoY Change
Jan-14 10.5%
Feb-14 10.1%
Mar-14 8.9%
Apr-14 7.9%
May-14 7.0%
Jun-14 6.3%
Jul-14 5.6%
Aug-14 5.1%
Sep-14 4.8%
Oct-14 4.6%
Nov-14 4.6%
Dec-14 4.5%
Jan-15 4.3%
Feb-15 4.2%
Mar-15 4.3%
Apr-15 4.3%
May-15 4.4%
Jun-15 4.5%
Jul-15 4.6%
Aug-15 4.7%

Most of the slowdown on a YoY basis is now behind us. This slowdown in price increases this year was expected by several key analysts, and I think it is good news for housing and the economy.

In the earlier post, I graphed nominal house prices, but it is also important to look at prices in real terms (inflation adjusted).  Case-Shiller, CoreLogic and others report nominal house prices.  As an example, if a house price was $200,000 in January 2000, the price would be close to $276,000 today adjusted for inflation (38%).  That is why the second graph below is important - this shows "real" prices (adjusted for inflation).

It has been almost ten years since the bubble peak.  In the Case-Shiller release this morning, the National Index was reported as being 6.7% below the bubble peak.   However, in real terms, the National index is still about 20.6% below the bubble peak.

Nominal House Prices


Nominal House PricesThe first graph shows the monthly Case-Shiller National Index SA, the monthly Case-Shiller Composite 20 SA, and the CoreLogic House Price Indexes (through August) in nominal terms as reported.

In nominal terms, the Case-Shiller National index (SA) is back to July 2005 levels, and the Case-Shiller Composite 20 Index (SA) is back to January 2005 levels, and the CoreLogic index (NSA) is back to July 2005.

Real House Prices

Real House PricesThe second graph shows the same three indexes in real terms (adjusted for inflation using CPI less Shelter). Note: some people use other inflation measures to adjust for real prices.

In real terms, the National index is back to July 2003 levels, the Composite 20 index is back to April 2003, and the CoreLogic index back to January 2004.

In real terms, house prices are back to 2003 levels.

Note: CPI less Shelter is down 1.1% year-over-year, so this is pushing up real prices.

Price-to-Rent

In October 2004, Fed economist John Krainer and researcher Chishen Wei wrote a Fed letter on price to rent ratios: House Prices and Fundamental Value. Kainer and Wei presented a price-to-rent ratio using the OFHEO house price index and the Owners' Equivalent Rent (OER) from the BLS.

Price-to-Rent Ratio
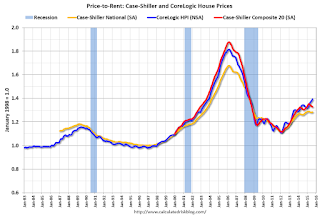
Here is a similar graph using the Case-Shiller National, Composite 20 and CoreLogic House Price Indexes.

This graph shows the price to rent ratio (January 1998 = 1.0).

On a price-to-rent basis, the Case-Shiller National index is back to May 2003 levels, the Composite 20 index is back to December 2002 levels, and the CoreLogic index is back to November 2003.

In real terms, and as a price-to-rent ratio, prices are back to 2003 levels - and the price-to-rent ratio maybe moving a little sideways now.

from Calculated Risk http://ift.tt/1idIZzf
via YQ Matrix

Forecast drop in European oil rigs expected to dampen barite prices

Declining drilling activity in Europe is likely to force price decreases for the drilling mud mineral, although Moroccan prices are reported to be holding firm.

from MPW - Pricing News http://ift.tt/1WgwArO
via IFTTT

Case-Shiller: National House Price Index increased 4.7% year-over-year in August

S&P/Case-Shiller released the monthly Home Price Indices for August ("August" is a 3 month average of June, July and August prices).

This release includes prices for 20 individual cities, two composite indices (for 10 cities and 20 cities) and the monthly National index.

Note: Case-Shiller reports Not Seasonally Adjusted (NSA), I use the SA data for the graphs.

From S&P: Widespread Gains in Home Prices for August According to the S&P/Case-Shiller Home Price Indices
The S&P/Case-Shiller U.S. National Home Price Index, covering all nine U.S. census divisions, recorded a slightly higher year-over-year gain with a 4.7% annual increase in August 2015 versus a 4.6% increase in July 2015. The 10-City Composite increased 4.7% in the year to August compared to 4.5% in the prior month. The 20-City Composite’s year-over-year gain was 5.1% versus 4.9% in the year to July.
...
Before seasonal adjustment, the National Index posted a gain of 0.3% month-over-month in August. The 10-City Composite and 20-City Composite both reported gains of 0.3% and 0.4% month-over-month respectively. After seasonal adjustment, the National Index posted a gain of 0.4%, while the 10-City and 20-City Composites both increased 0.1% month-over-month. Eighteen of 20 cities reported increases in August before seasonal adjustment; after seasonal adjustment, five were down, 11 were up, and four were unchanged.
...
“Home prices continue to climb at a 4% to 5% annual rate across the country,” says David M. Blitzer, Managing Director and Chairman of the Index Committee for S&P Dow Jones Indices.
emphasis added
Case-Shiller House Prices Indices Click on graph for larger image.

The first graph shows the nominal seasonally adjusted Composite 10, Composite 20 and National indices (the Composite 20 was started in January 2000).

The Composite 10 index is off 14.8% from the peak, and up 0.1% in August (SA).

The Composite 20 index is off 13.6% from the peak, and up 0.1% (SA) in August.

The National index is off 6.7% from the peak, and up 0.4% (SA) in August.  The National index is up 26.1% from the post-bubble low set in December 2011 (SA).

Case-Shiller House Prices Indices The second graph shows the Year over year change in all three indices.

The Composite 10 SA is up 4.7% compared to August 2014.

The Composite 20 SA is up 5.1% year-over-year..

The National index SA is up 4.7% year-over-year.

Prices increased (SA) in 13 of the 20 Case-Shiller cities in August seasonally adjusted.  (Prices increased in 18 of the 20 cities NSA)  Prices in Las Vegas are off 39.2% from the peak, and prices in Denver and Dallas are at new highs (SA).

Case-Shiller CitiesThe last graph shows the bubble peak, the post bubble minimum, and current nominal prices relative to January 2000 prices for all the Case-Shiller cities in nominal terms.

As an example, at the peak, prices in Phoenix were 127% above the January 2000 level. Then prices in Phoenix fell slightly below the January 2000 level, and are now up 53% above January 2000 (53% nominal gain in almost 16 years).

These are nominal prices, and real prices (adjusted for inflation) are up about 40% since January 2000 - so the increase in Phoenix from January 2000 until now is about 12% above the change in overall prices due to inflation.

Two cities - Denver (up 68% since Jan 2000) and Dallas (up 51% since Jan 2000) - are above the bubble highs (a few other Case-Shiller Comp 20 city are close - Boston, Charlotte, San Francisco, Portland).    Detroit prices are barely above the January 2000 level.

I'll have more on house prices later.

from Calculated Risk http://ift.tt/1kLYT5P
via YQ Matrix

Monday 26 October 2015

Tuesday: Case-Shiller House Prices, Durable Goods

From Nick Timiraos And Siobhan Hughes at the WSJ: White House and Boehner Close In on Budget Deal
The White House and Speaker John Boehner (R., Ohio) Monday were nearing a deal on a two-year budget plan that would also increase the federal debt limit, according to people familiar with the discussions.
...
A main object of the talks is to remove the risk that the government might default next month or face a partial government shutdown in December. A deal would suspend the debt limit into early 2017 and establish new spending levels through September 2017, according to people familiar with the discussions.
Tuesday:
• At 8:30 AM ET, Durable Goods Orders for September from the Census Bureau. The consensus is for a 1.0% decrease in durable goods orders.

• At 9:00 AM, S&P/Case-Shiller House Price Index for August. Although this is the August report, it is really a 3 month average of June, July and August prices. The consensus is for a 5.1% year-over-year increase in the Comp 20 index for August. The Zillow forecast is for the National Index to increase 4.7% year-over-year in August.

• At 10:00 AM, the Richmond Fed Survey of Manufacturing Activity for October.

• Also at 10:00 AM, the Q3 Housing Vacancies and Homeownership from the Census Bureau.

from Calculated Risk http://ift.tt/1Racu13
via YQ Matrix

Black Knight: House Price Index up 0.3% in August, Up 5.5% year-over-year

Note: I follow several house price indexes (Case-Shiller, CoreLogic, Black Knight, Zillow, FHFA, FNC and more). Note: Black Knight uses the current month closings only (not a three month average like Case-Shiller or a weighted average like CoreLogic), excludes short sales and REOs, and is not seasonally adjusted.

From Black Knight: U.S. Home Prices Up 0.3 Percent for the Month; Up 5.5 Percent Year-Over-Year
Today, the Data and Analytics division of Black Knight Financial Services, Inc. released its latest Home Price Index (HPI) report, based on August 2015 residential real estate transactions in the United States. The Black Knight HPI combines the company's extensive property and loan-level databases to produce a repeat sales analysis of home prices as of their transaction dates every month for each of more than 18,500 U.S. ZIP codes. The Black Knight HPI represents the price of non-distressed sales by taking into account price discounts for REO and short sales.

For a more in-depth review of this month's home price trends, including detailed views of results from the 20 largest states and 40 largest metros, please download the full Black Knight HPI Report.
The Black Knight HPI increased 0.3% percent in August, and is off 5.3% from the peak in June 2006 (not adjusted for inflation).

The year-over-year increase in the index has been about the same for the last year.

The report has data for the 20 largest states, and 40 MSAs.

Black Knight shows prices off 37.4% from the peak in Las Vegas, off 31.1% in Orlando, and 27.4% off from the peak in Riverside-San Bernardino, CA (Inland Empire).

Note: Case-Shiller for August will be released tomorrow.

from Calculated Risk http://ift.tt/1GD7bXj
via YQ Matrix

Sunday 25 October 2015

Monday: New Home Sales

Most economist think there is a better than 50% chance of a Fed rate hike in December. Analysts and traders don't think so. From Min Zeng at the WSJ: Betting Against a Fed Rate Rise
[Global] developments, together with mixed U.S. economic data in recent months, increase the likelihood the Fed will keep interest rates near zero for the rest of 2015, according to analysts and traders ...

The odds Friday were measured at 37% for an increase at the Dec. 15-16 policy meeting, compared with 44% last month.
Weekend:
Schedule for Week of October 25, 2015

Monday:
• At 10:00 AM ET, New Home Sales for September from the Census Bureau. The consensus is for a decrease in sales to 549 thousand Seasonally Adjusted Annual Rate (SAAR) in September from 552 thousand in August.

• At 10:30 AM, Dallas Fed Manufacturing Survey for October.

From CNBC: Pre-Market Data and Bloomberg futures: currently S&P futures are down 2 and DOW futures are dwon 25 (fair value).

Oil prices were down over the last week with WTI futures at $44.61 per barrel and Brent at $47.99 per barrel.  A year ago, WTI was at $81, and Brent was at $86 - so prices are down about 40% year-over-year (It was a year ago that prices were falling sharply).

Here is a graph from Gasbuddy.com for nationwide gasoline prices. Nationally prices are at $2.20 per gallon (down about $0.85 per gallon from a year ago).

from Calculated Risk http://ift.tt/1k3BA6E
via YQ Matrix

Saturday 24 October 2015

Schedule for Week of October 25th

The key reports this week are September New Home sales on Monday, the advance estimate of Q3 GDP on Thursday, and August Case-Shiller house prices on Tuesday.

The FOMC meets on Tuesday and Wednesday, but no change in policy is expected.

----- Monday, October 26th -----

New Home Sales10:00 AM: New Home Sales for September from the Census Bureau.

This graph shows New Home Sales since 1963. The dashed line is the August sales rate.

The consensus is for a decrease in sales to 549 thousand Seasonally Adjusted Annual Rate (SAAR) in September from 552 thousand in August.

10:30 AM: Dallas Fed Manufacturing Survey for October.

----- Tuesday, October 27th -----

8:30 AM: Durable Goods Orders for September from the Census Bureau. The consensus is for a 1.0% decrease in durable goods orders.

Case-Shiller House Prices Indices9:00 AM: S&P/Case-Shiller House Price Index for August. Although this is the August report, it is really a 3 month average of June, July and August prices.

This graph shows the nominal seasonally adjusted National Index, Composite 10 and Composite 20 indexes through the July 2015 report (the Composite 20 was started in January 2000).

The consensus is for a 5.1% year-over-year increase in the Comp 20 index for August. The Zillow forecast is for the National Index to increase 4.7% year-over-year in August.

10:00 AM: Richmond Fed Survey of Manufacturing Activity for October.

10:00 AM: the Q3 Housing Vacancies and Homeownership from the Census Bureau.

----- Wednesday, October 28th -----

7:00 AM ET: The Mortgage Bankers Association (MBA) will release the results for the mortgage purchase applications index.

2:00 PM: FOMC Meeting Announcement.  No change in policy is expected at this meeting.

----- Thursday, October 29th -----

8:30 AM ET: Gross Domestic Product, 3rd quarter 2015 (Advance estimate). The consensus is that real GDP increased 1.7% annualized in Q3.

8:30 AM: The initial weekly unemployment claims report will be released.  The consensus is for 265 thousand initial claims, up from 259 thousand the previous week.

10:00 AM: Pending Home Sales Index for September. The consensus is for a 1.0% increase in the index.

----- Friday, October 30th -----

8:30 AM ET: Personal Income and Outlays for September. The consensus is for a 0.2% increase in personal income, and for a 0.2% increase in personal spending. And for the Core PCE price index to increase 0.2%.

8:30 AM ET: Employment Cost Index for Q3.  The consensus is for a 0.6% increase in Q3.

9:45 AM: Chicago Purchasing Managers Index for October. The consensus is for a reading of 49.2, up from 48.7 in September.

10:00 AM: University of Michigan's Consumer sentiment index (final for October). The consensus is for a reading of 92.5, up from the preliminary reading of 92.1.

from Calculated Risk http://ift.tt/1KwoHaJ
via YQ Matrix

Friday 23 October 2015

Merrill on Q3 GDP and Headwinds

The advance estimate for Q3 GDP will be released Thursday October 29th. Here is Merrill Lynch's forecast:
The economy has faced some strong headwinds this year, including a sharp rise in the dollar, weaker-than-expected global growth and sharp cuts in oil sector investment. Further, the economy is in the middle of an inventory correction. Weaker data, particularly for inventories, has contributed to lower GDP tracking, and we are now incorporating that weakness into our official forecast, cutting 3Q real GDP growth by 0.8pp to 1.2%. This lowers 2014 annual GDP growth to 2.4% from 2.5%. Looking past trade and inventories, domestic demand is expected to remain strong, rising by 3.5% in 3Q 2015, and by 3.0% in 2015 as a whole.
And on headwinds for the U.S. economy:
First, while the economy faces new global headwinds, the fundamental backdrop for the domestic economy has improved significantly. Post-crisis deleveraging has largely run its course. The housing and banking sectors are back on their feet. And Washington is no longer a major source of austerity and confidence shocks: Federal and state and local fiscal policy has shifted from a 1% or higher GDP headwind to a small tailwind and Americans have learned to largely ignore the budget battles in Washington. In our view, the new global headwinds—a strong dollar, weak growth in emerging markets and weak commodity prices—have less impact on US growth than the fading domestic headwinds –deleveraging, crippled banking and housing sectors and fiscal shocks.

Second, it is important to get the timing of the various shocks right. In our view, most of the hit to growth from global developments has already happened. The strong dollar is an ongoing drag on growth, but model simulations suggest a hump-shape pattern, with small effects last year, a peak drag on growth this summer and diminishing drag in the quarters ahead. On a similar vein, the biggest hit from the collapse in oil prices is behind us, with the collapse in mining investment in the first half of the year. Going forward, we expect a small net effect from low prices as a slow decline in mining related activity is offset or more than offset by consumers spending more of their savings from lower gas prices. The same applies to the inventory adjustment: almost all of the correction came in 3Q. The only shock that builds, rather than diminishes, going forward is the trade and confidence shocks from weakness in China and the rest of emerging markets. Our hope and expectation is that these effects will be small.
The future is bright!

from Calculated Risk http://ift.tt/1NYL9B8
via YQ Matrix

A Few Random Comments on September Existing Home Sales

Once again, housing economist Tom Lawler's projection of the NAR reported sales rate was much closer than the consensus. For September, the NAR reported sales of 5.55 million on a seasonally adjusted annual rate (SAAR) basis, the consensus was 5.35 million, and Lawler's projection was 5.56 million (almost exact).  Thanks to Tom for sharing his research with all of us!

Yesterday: Existing Home Sales in September: 5.55 million SAAR

Even though sales were up in September, I expect that the seasonally adjusted pace for existing home sales will slow in coming months due to limited inventory and higher prices.

However, if sales do slow, it is important to remember that new home sales are more important for jobs and the economy than existing home sales. Since existing sales are existing stock, the only direct contribution to GDP is the broker's commission. There is usually some additional spending with an existing home purchase - new furniture, etc - but overall the economic impact is small compared to a new home sale.  So some slowing for existing home sales (if it happens) will not be a big deal for the economy.

Also, I've been expecting some increase in inventory this year, but it hasn't happened yet.  Inventory is still very low (down 3.1% year-over-year in September). More inventory would probably mean smaller price increases and slightly higher sales, and less inventory means lower sales and somewhat larger price increases.

Also, the NAR reported distressed sales declined a little further year-over-year:
Distressed sales — foreclosures and short sales — remained at 7 percent in September for the third consecutive month; they were 10 percent a year ago. Six percent of September sales were foreclosures and 1 percent (lowest since NAR began tracking in October 2008) were short sales.
The following graph shows existing home sales Not Seasonally Adjusted (NSA).

Existing Home Sales NSAClick on graph for larger image.

Sales NSA in September (red column) were the highest for September since 2006 (NSA).

from Calculated Risk http://ift.tt/1OWzd1j
via YQ Matrix

Philly Fed: State Coincident Indexes increased in 41 states in September

From the Philly Fed:
The Federal Reserve Bank of Philadelphia has released the coincident indexes for the 50 states for September 2015. In the past month, the indexes increased in 41 states, decreased in six, and remained stable in three, for a one-month diffusion index of 70. Over the past three months, the indexes increased in 43 states, decreased in six, and remained stable in one, for a three-month diffusion index of 74.
Note: These are coincident indexes constructed from state employment data. An explanation from the Philly Fed:
The coincident indexes combine four state-level indicators to summarize current economic conditions in a single statistic. The four state-level variables in each coincident index are nonfarm payroll employment, average hours worked in manufacturing, the unemployment rate, and wage and salary disbursements deflated by the consumer price index (U.S. city average). The trend for each state’s index is set to the trend of its gross domestic product (GDP), so long-term growth in the state’s index matches long-term growth in its GDP.
Philly Fed Number of States with Increasing ActivityClick on graph for larger image.

This is a graph is of the number of states with one month increasing activity according to the Philly Fed. This graph includes states with minor increases (the Philly Fed lists as unchanged).

In September, 42 states had increasing activity (including minor increases).

The worst performing states over the last 6 months are West Virginia (coal), North Dakota (oil), Alaska (oil), Wyoming, and Oklahoma (oil).


Philly Fed State Conincident Map Here is a map of the three month change in the Philly Fed state coincident indicators. This map was all red during the worst of the recession, and is mostly green now.

Note: Blue added for Red/Green issues.

from Calculated Risk http://ift.tt/1MeO0Wp
via YQ Matrix

Chinese and Indian potash buyers seeking price cuts, says ICL chief

The soft underbelly of the global potash market could see prices fall over the next year by as much as $20/tonne, according to Stefan Borgas.

from MPW - Pricing News http://ift.tt/1RsaYHo
via IFTTT

Chinese and Indian potash buyers seeking price cuts according to ICL chief

The soft underbelly of the global potash market could see prices fall over the next year by as much as $20/tonne, according to Stefan Borgas.

from MPW - Pricing News http://ift.tt/1MIova9
via IFTTT

Price Briefing 16 – 22 October

Prices for ceramic materials minerals and fluorspar down as rare earths experience slight increase.

from MPW - Pricing News http://ift.tt/1LR35LA
via IFTTT

Rare earths prices rumoured to be rising in wake of recent Chinese supply cuts

Prices appear to firm following changes in rare earths industry structure, taxation and production levels in China.

from MPW - Pricing News http://ift.tt/1GsGaWC
via IFTTT

Thursday 22 October 2015

Acidspar prices succumb to oversupply

Price review: After more than two years of weak demand, acidspar grades slipped as new capacity reaches the market.

from MPW - Pricing News http://ift.tt/1GkldNG
via IFTTT

Kansas City Fed: Regional Manufacturing Activity "Steadied" in October

From the Kansas City Fed: Tenth District Manufacturing Activity Steadied
The Federal Reserve Bank of Kansas City released the October Manufacturing Survey today. According to Chad Wilkerson, vice president and economist at the Federal Reserve Bank of Kansas City, the survey revealed that Tenth District manufacturing activity steadied somewhat and was expected to remain largely unchanged heading forward.

Following six months of composite index readings of worse than -6, this month’s reading of -1 was somewhat encouraging,” said Wilkerson. “Modest increases in new orders and production nearly offset declines in employment, supplier delivery time, and inventory indexes.”
...
Tenth District manufacturing activity steadied somewhat, and expectations for future activity were largely flat following last month’s more negative reading. Most price indexes edged higher for the first time in several months.

The month-over-month composite index was -1 in October, up from -8 in September and -9 in August ...
emphasis added
The earlier decline in the Kansas City region manufacturing was probably mostly due to lower oil prices, although respondents are also blame weaker exports on the strong dollar.

from Calculated Risk http://ift.tt/200JzCz
via YQ Matrix

NEW: YQ Prices of the Periodic Table


YQ Matrix just launched its new YQ Price and Sourcing graphs for Mendeleev's Periodic Table elements. All summarized on one single webpage: http://goo.gl/0Dk75L. Extremely fast! Have a look!

NEW: YQ Prices of the Periodic Table


YQ Matrix just launched its new YQ Price and Sourcing graphs for Mendeleev's Periodic Table elements.  All summarized on one single webpage: http://goo.gl/0Dk75L. Extremely fast! Have a look!

Wednesday 21 October 2015

Thursday: Existing Home Sales, Unemployment Claims, Apartment Tightness Index and More

Here is a hint ... take the "over" on existing home sales.

Thursday:
• At 8:30 AM ET, the initial weekly unemployment claims report will be released. The consensus is for 265 thousand initial claims, up from 255 thousand the previous week.

• Also at 8:30 AM, the Chicago Fed National Activity Index for September. This is a composite index of other data.

• At 9:00 AM, the FHFA House Price Index for August 2015. This was originally a GSE only repeat sales, however there is also an expanded index. The consensus is for a 0.5% month-to-month increase for this index.

• At 10:00 AM, Existing Home Sales for September from the National Association of Realtors (NAR). The consensus is for 5.35 million SAAR, up from 5.31 million in August. Economist Tom Lawler estimates the NAR will report sales of 5.56 million SAAR. A key will be the reported year-over-year change in inventory of homes for sale.

• At 11:00 AM, the Kansas City Fed manufacturing survey for September.

• During the day: Q3 NMHC Apartment Tightness Index.

from Calculated Risk http://ift.tt/1OJtn50
via YQ Matrix

Toyota to Recall 6.5 Million Vehicles to Fix Window Switches


By JONATHAN SOBLE from NYT Business Day http://ift.tt/1NUaXOM
This content was assembled for you by the YQ Matrix platform

The views expressed in this post and throughout the series are the autor's own and not intended to reflect the views the YQ Matrix platform, its users or any associated organisations.

For the procurement people among you, have a look at the latest YQ Matrix raw material and semi-finished prices. For: Prices on other websites.

Tuesday 20 October 2015

Breakfast Recipes From Yotam Ottolenghi’s New Cookbook


By ADAM ROBB from NYT T Magazine http://ift.tt/1OP5ebt
This content was assembled for you by the YQ Matrix platform

The views expressed in this post and throughout the series are the autor's own and not intended to reflect the views the YQ Matrix platform, its users or any associated organisations.

For the procurement people among you, have a look at the latest YQ Matrix raw material and semi-finished prices. For: Prices on other websites.

Monday 19 October 2015

Magnesia price weakness threatens to eat into higher purity grades

Domestic Chinese FM prices reported to be softening although international sources say market is flat.

from MPW - Pricing News http://ift.tt/1ODgVU8
via IFTTT

Sunday 18 October 2015

Sunday Night Futures

Weekend:
Schedule for Week of October 18, 2015

Monday:
• At 10:00 AM, the October NAHB homebuilder survey. The consensus is for a reading of 62, unchanged from September. Any number above 50 indicates that more builders view sales conditions as good than poor.

From CNBC: Pre-Market Data and Bloomberg futures: currently S&P futures and DOW futures are mostly unchanged (fair value).

Oil prices were down over the last week with WTI futures at $47.31 per barrel and Brent at $50.50 per barrel.  A year ago, WTI was at $82, and Brent was at $85 - so prices are down about 40% year-over-year (It was a year ago that prices were falling sharply).

Here is a graph from Gasbuddy.com for nationwide gasoline prices. Nationally prices are at $2.26 per gallon (down about $0.75 per gallon from a year ago).

from Calculated Risk http://ift.tt/1KiDoye
via YQ Matrix

Saturday 17 October 2015

Schedule for Week of October 18th

The key economic reports this week are September housing starts on Tuesday, and September Existing Home Sales on Thursday.


----- Monday, October 19th -----

10:00 AM: The October NAHB homebuilder survey. The consensus is for a reading of 62, unchanged from September.  Any number above 50 indicates that more builders view sales conditions as good than poor.

----- Tuesday, October 20th -----

Total Housing Starts and Single Family Housing Starts8:30 AM: Housing Starts for September.

Total housing starts decreased to 1.126 million (SAAR) in August. Single family starts decreased to 739 thousand SAAR in August.

The consensus for 1.147 million, up from August.

10:00 AM ET: Regional and State Employment and Unemployment for September.

----- Wednesday, October 21st -----

7:00 AM ET: The Mortgage Bankers Association (MBA) will release the results for the mortgage purchase applications index.

During the day: The AIA's Architecture Billings Index for September (a leading indicator for commercial real estate).

----- Thursday, October 22nd -----

8:30 AM ET: The initial weekly unemployment claims report will be released.  The consensus is for 265 thousand initial claims, up from 255 thousand the previous week.

8:30 AM ET: Chicago Fed National Activity Index for September. This is a composite index of other data.

9:00 AM: FHFA House Price Index for August 2015. This was originally a GSE only repeat sales, however there is also an expanded index.  The consensus is for a 0.5% month-to-month increase for this index.

Existing Home Sales10:00 AM: Existing Home Sales for September from the National Association of Realtors (NAR). The consensus is for 5.35 million SAAR, up from 5.31 million in August.

Economist Tom Lawler estimates the NAR will report sales of 5.56 million SAAR.

A key will be the reported year-over-year change in inventory of homes for sale.

11:00 AM: the Kansas City Fed manufacturing survey for September.

During the day: Q3 NMHC Apartment Tightness Index.

----- Friday, October 23rd -----

No economic released scheduled.

from Calculated Risk http://ift.tt/1OAAGf2
via YQ Matrix

Friday 16 October 2015

Lawler: Early Read on Existing Home Sales in September

From housing economist Tom Lawler:

Based on publicly-released realtor/MLS reports from across the country released through today, I project that US existing home sales as estimated by the National Association of Realtors ran at a seasonally adjusted annual rate of about 5.56 million in September, up about 4.7% from August’s preliminary pace and up 9.0% from last September’s seasonally-adjusted pace. I expect the NAR’s estimate of the inventory of existing homes for sale at the end of September to be down about 1.7% from August’s preliminary estimate, and down about 1.3% from last September. Finally, I expect the NAR’s median existing home sales price estimate for September to be up about 5.5% from last September.

Post-Mortem on August’s Existing Home Sales Report: NAR’s Estimate of the YOY % Change in Unadjusted Sales Seems Reasonable

On September 21st the NAR estimated that US existing home sales ran at a seasonally adjusted annual rate of 5.31 million in August – far below both the “consensus” forecast and my projection based on realtor/MLS reports available as of September 15th. As I acknowledged following the NAR EHS report for August, part of my “miss” reflected a “misread” of the likely seasonal factor used to adjust the “raw” sales data. However, my projection was also off because the “sample” of local realtor/MLS reports I had available as of September 15th proved to be a poor representation of the larger sample of local realtor/MLS reports for August that include reports subsequently released. Based on this larger sample, the NAR’s estimate of the YOY % change in existing home sales in August seems broadly consistent with local realtor/MLS reports.

If, in fact, my September projection for existing home sales is correct, then one might ask: why have there been such large month swings in seasonally-adjusted home sales over the past several months? My gut is that some of these swings have been less related to volatile markets, and more related to difficulties in accurately estimating the true “seasonal” component of existing home sales. Statistical estimates of this seasonal pattern of home sales have changed considerably over the past 10-15 years, and it is quite possible that some of the observed change in the “seasonal” pattern may actually be related to other forces (witness, e.g., the huge increase in the amplitude of “seasonal” swings in home prices since the housing collapse, which most analyst attribute to the combination of the surge in distressed sales and the seasonal pattern of the distressed-sales share of total home sales).

CR Note: The NAR is scheduled to release September Existing Home Sales on Thursday, Oct 22nd.  The consensus forecast is for 5.36 million (this will move up after this is posted).  Take the over!


from Calculated Risk http://ift.tt/1Mupjzr
via YQ Matrix

Earlier: Preliminary October Consumer Sentiment increases to 92.1

The preliminary University of Michigan consumer sentiment index for October was at 92.1, up from 87.2 in September.
"The rebound in confidence signifies that consumers have concluded that the fears expressed on Wall Street did not extend to Main Street. Importantly, the renewed confidence did not simply represent a relief rally, but instead reflected renewed optimism. Personal financial expectations rose to their highest level since 2007, as did consumers' views toward purchases of durable goods. While consumers anticipate a continued economic expansion, many expected strong headwinds from falling commodity prices, weakened economies in China and elsewhere as well as continued stresses on European countries. Perhaps the most important finding is that low inflation and continued job growth have enabled consumers to adapt to a slower and more variable rate of economic growth by varying the pace of their spending without losing confidence that the expansion will continue. Overall, the data still indicate that consumption will expand at 2.9% during 2016."
This was above the consensus forecast of 89.5.

Consumer Sentiment
Click on graph for larger image.

from Calculated Risk http://ift.tt/1Pmxkwo
via YQ Matrix

Price Briefing 9 – 15 October

Graphite and rare earths remain flat while lithium prices rise in China.

from MPW - Pricing News http://ift.tt/1LROamp
via IFTTT

Thursday 15 October 2015

Friday: Industrial Production, Jobs Openings, Consumer Sentiment

Commercial real estate prices are increasing significantly, from CoStar: CCRSI: Commercial Property Price Growth Continued To Heat Up In August
While construction is rising in many markets, aggregate demand across the major property types continues to outstrip supply, resulting in tighter vacancy rates and rent growth, which in turn, continues to drive strong investor interest in commercial real estate. In August 2015, the two broadest measures of aggregate pricing for commercial properties within the CCRSI—the value-weighted U.S. Composite Index and the equal-weighted U.S. Composite Index—increased by 1.3% and 1%, respectively, and 12.6% and 11.4%, respectively, in the 12 months ended August 2015.
These are repeat sales indexes - like Case-Shiller for residential - but this is based on far fewer pairs.

Friday:
• At 9:15 AM ET, the Fed will release Industrial Production and Capacity Utilization for September. The consensus is for a 0.3% decrease in Industrial Production, and for Capacity Utilization to decrease to 77.4%.

• At 10:00 AM, Job Openings and Labor Turnover Survey for August from the BLS. Jobs openings increased in July to 5.753 million from 5.323 million in June. The number of job openings were up 22% year-over-year, and Quits were up 6% year-over-year.

• Also at 10:00 AM, the University of Michigan's Consumer sentiment index (preliminary for October). The consensus is for a reading of 89.5, up from 87.2 in September.

from Calculated Risk http://ift.tt/1GJh6VT
via YQ Matrix

Indonesian President to Court Tech Giants on U.S. Trip


By REUTERS from NYT Technology http://ift.tt/1QxBmzt
This content was assembled for you by the YQ Matrix platform

The views expressed in this post and throughout the series are the autor's own and not intended to reflect the views the YQ Matrix platform, its users or any associated organisations.

For the procurement people among you, have a look at the latest YQ Matrix raw material and semi-finished prices. For: Prices on other websites.

Key Measures Show Inflation slightly higher in September

The Cleveland Fed released the median CPI and the trimmed-mean CPI this morning:
According to the Federal Reserve Bank of Cleveland, the median Consumer Price Index rose 0.3% (3.4% annualized rate) in September. The 16% trimmed-mean Consumer Price Index rose 0.2% (2.6% annualized rate) during the month. The median CPI and 16% trimmed-mean CPI are measures of core inflation calculated by the Federal Reserve Bank of Cleveland based on data released in the Bureau of Labor Statistics' (BLS) monthly CPI report.

Earlier today, the BLS reported that the seasonally adjusted CPI for all urban consumers fell 0.2% (-1.8% annualized rate) in September. The CPI less food and energy rose 0.2% (2.6% annualized rate) on a seasonally adjusted basis.
Note: The Cleveland Fed has the median CPI details for September here. Motor fuel was down sharply again in September.

Inflation Measures Click on graph for larger image.

This graph shows the year-over-year change for these four key measures of inflation. On a year-over-year basis, the median CPI rose 2.5%, the trimmed-mean CPI rose 1.8%, and the CPI less food and energy rose 1.9%. Core PCE is for August and increased 1.2% year-over-year.

On a monthly basis, median CPI was at 3.4% annualized, trimmed-mean CPI was at 2.6% annualized, and core CPI was at 2.6% annualized.

On a year-over-year basis these measures suggest inflation remains below the Fed's target of 2% (median CPI is above 2%).

Inflation is still low, but mostly moving up a little.

from Calculated Risk http://ift.tt/1jDFEdE
via YQ Matrix

Chinese lithium prices take cue from FMC increase

FMC’s 15% hike in lithium carbonate prices came into effect at the beginning of this month and has prompted Chinese rival to also increase selling values, supported by strong demand from the battery sector.

from MPW - Pricing News http://ift.tt/1Pj4FZ2
via IFTTT

CPI decreased 0.2% in September, Weekly Initial Unemployment Claims decreased to 255,000

From the BLS:
The Consumer Price Index for All Urban Consumers (CPI-U) decreased 0.2 percent in September on a seasonally adjusted basis, the U.S. Bureau of Labor Statistics reported today. Over the last 12 months, the all items index was essentially unchanged before seasonal adjustment.

The energy index fell 4.7 percent in September, with all major component indexes declining. The gasoline index continued to fall sharply and was again the main cause of the seasonally adjusted all items decrease. The indexes for fuel oil, electricity, and natural gas declined as well.

In contrast to the energy declines, the indexes for food and for all items less food and energy both accelerated in September. The food index rose 0.4 percent, its largest increase since May 2014. The index for all items less food and energy rose 0.2 percent in September.
emphasis added
I'll post a graph later today after the Cleveland Fed releases the median and trimmed-mean CPI. This was at the consensus forecast of a 0.2% decrease for CPI, and above the forecast of a 0.1% increase in core CPI.

The DOL reported:
In the week ending October 10, the advance figure for seasonally adjusted initial claims was 255,000, a decrease of 7,000 from the previous week's revised level. The previous week's level was revised down by 1,000 from 263,000 to 262,000. The 4-week moving average was 265,000, a decrease of 2,250 from the previous week's revised average. This is the lowest level for this average since December 15, 1973 when it was 256,750. The previous week's average was revised down by 250 from 267,500 to 267,250.

There were no special factors impacting this week's initial claims.
The previous week was revised down to 262,000.

The following graph shows the 4-week moving average of weekly claims since 1971.

Click on graph for larger image.


The dashed line on the graph is the current 4-week average. The four-week average of weekly unemployment claims decreased to 265,000.  This is the lowest level in over 40 years.

This was below the consensus forecast of 270,000, and the low level of the 4-week average suggests few layoffs.

from Calculated Risk http://ift.tt/1Pv1kp3
via YQ Matrix