Russian coke is reaching European market and with end users swapping to cheaper material, prices for amorphous graphite are following flake values down. In lithium meanwhile list price increases have been confirmed in China as export destinations feel market tightness.
from MPW - Pricing News http://ift.tt/1IxgEer
via IFTTT
Monday 30 November 2015
Year-end promises few celebrations for mineral suppliers
Barite prices expected to fall further as fluorspar and graphite face negative revisions. Meanwhile, lithium prices continue to rise in China.
from MPW - Pricing News http://ift.tt/1OruzsX
via IFTTT
from MPW - Pricing News http://ift.tt/1OruzsX
via IFTTT
Foreign Carmakers to Keep Price Edge as Ford Faces Higher Labor Costs
By REUTERS from NYT Business Day http://ift.tt/1NDT3QI
This content was assembled for you by the YQ Matrix platform
The views expressed in this post and throughout the series are the autor's own and not intended to reflect the views the YQ Matrix platform, its users or any associated organisations.
For the procurement people among you, have a look at the latest YQ Matrix raw material and semi-finished prices. For: Prices on other websites.
Restaurant Performance Index indicates faster expansion in October
Here is a minor indicator I follow from the National Restaurant Association: Restaurant Performance Index Rose in October
 Click on graph for larger image.
The index increased to 102.1 in October, down from 101.4 in September. (above 100 indicates expansion).
Restaurant spending is discretionary, so even though this is "D-list" data, I like to check it every month. This index is indicated decent expansion in October, and it appears restaurants are benefiting from lower gasoline prices and the improved labor market.
from Calculated Risk http://ift.tt/1RgZYiv
via YQ Matrix
Driven by stronger same-store sales and a more optimistic outlook among restaurant operators, the National Restaurant Association’s Restaurant Performance Index (RPI) posted a moderate gain in October. The RPI – a monthly composite index that tracks the health of and outlook for the U.S. restaurant industry – stood at 102.1 in October, up 0.7 percent from a level of 101.4 in September. In addition, October represented the 32nd consecutive month in which the RPI stood above 100, which signifies expansion in the index of key industry indicators.
...
“The October gain in the RPI was buoyed by broad-based improvements in the current situation indicators,” said Hudson Riehle, senior vice president of the Research and Knowledge Group for the Association. “In addition, restaurant operators are somewhat more optimistic about both sales growth and the economy in the months ahead.”
emphasis added
The index increased to 102.1 in October, down from 101.4 in September. (above 100 indicates expansion).
Restaurant spending is discretionary, so even though this is "D-list" data, I like to check it every month. This index is indicated decent expansion in October, and it appears restaurants are benefiting from lower gasoline prices and the improved labor market.
from Calculated Risk http://ift.tt/1RgZYiv
via YQ Matrix
Ford to Book $600M 4Q Expense for New Labor Contract
By THE ASSOCIATED PRESS from NYT U.S. http://ift.tt/1OzV0Lb
This content was assembled for you by the YQ Matrix platform
The views expressed in this post and throughout the series are the autor's own and not intended to reflect the views the YQ Matrix platform, its users or any associated organisations.
For the procurement people among you, have a look at the latest YQ Matrix raw material and semi-finished prices. For: Prices on other websites.
Chicago PMI declines to 48.7
Chicago PMI: Nov Chicago Business Barometer Down 7.5 Points To 48.7

from Calculated Risk http://ift.tt/1NDGW68
via YQ Matrix
The Chicago Business Barometer decreased 7.5 points to 48.7 in November from 56.2 in October, as a sharp fall in New Orders put it back into contraction for the sixth time this year.This was well below the consensus forecast of 54.0.
The significant decline in the Barometer is indicative of the see-saw pattern of demand seen in 2015, with output and orders shifting in and out of contraction. The November fall also suggests that activity over the final quarter of the year may well decelerate barring a bounceback in December.
New Orders fell 15.3 points to 44.1 in November from 59.4 in October, leaving it at the lowest level since March. Production also fell sharply, although managed to hold just above the neutral 50 level that separates expansion from contraction.
...
Chief Economist of MNI Indicators Philip Uglow said, “That the Barometer was unable to hold on to the gain seen in October is a reflection of the erratic pattern of demand seen throughout 2015. The slowdown in the global economy, the strong dollar and decline in oil prices have all impacted businesses this year to varying degrees.”
emphasis added
from Calculated Risk http://ift.tt/1NDGW68
via YQ Matrix
Falling sales and prices drag down China’s antimony trioxide market
Slowing demand from end markets is failing to keep pace with capacity while softening ingot prices are eroding trioxide selling values.
from MPW - Pricing News http://ift.tt/1YCQy2O
via IFTTT
from MPW - Pricing News http://ift.tt/1YCQy2O
via IFTTT
Sunday 29 November 2015
Monday: Chicago PMI, Pending Home Sales
From the WSJ: Divergent Paths for U.S., European Central Banks
Monday:
• At 9:45 AM ET, the Chicago Purchasing Managers Index for November. The consensus is for a reading of 54.0, down from 56.2 in October.
• At 10:00 AM, Pending Home Sales Index for October. The consensus is for a 1.0% increase in the index.
• At 10:30 AM, Dallas Fed Manufacturing Survey for November.
Weekend:
• Schedule for Week of November 29, 2015
From CNBC: Pre-Market Data and Bloomberg futures: currently S&P futures and DOW futures are down slightly (fair value).
Oil prices were up slightly over the last week with WTI futures at $41.71 per barrel and Brent at $44.86 per barrel. A year ago, WTI was at $66, and Brent was at $71 - so prices are down about 35% year-over-year (It was a year ago that prices were falling sharply).
Here is a graph from Gasbuddy.com for nationwide gasoline prices. Nationally prices are at $2.04 per gallon (down about $0.75 per gallon from a year ago).
from Calculated Risk http://ift.tt/1IiADmq
via YQ Matrix
This break in rate policy, particularly between the Fed and the European Central Bank, could strengthen the dollar even further against the euro, crimping U.S. exporters while giving a leg up to European ones.US policymakers responded to the financial crisis quicker, and with better policy (although the US made a premature pivot to austerity on fiscal policy, fiscal policy in Europe was much worse).
The divergent paths highlight how much more vigorous the U.S. recovery has been, particularly on the hiring front, a trend economists expect to see continue when the U.S. job numbers for November come out Friday.
Monday:
• At 9:45 AM ET, the Chicago Purchasing Managers Index for November. The consensus is for a reading of 54.0, down from 56.2 in October.
• At 10:00 AM, Pending Home Sales Index for October. The consensus is for a 1.0% increase in the index.
• At 10:30 AM, Dallas Fed Manufacturing Survey for November.
Weekend:
• Schedule for Week of November 29, 2015
From CNBC: Pre-Market Data and Bloomberg futures: currently S&P futures and DOW futures are down slightly (fair value).
Oil prices were up slightly over the last week with WTI futures at $41.71 per barrel and Brent at $44.86 per barrel. A year ago, WTI was at $66, and Brent was at $71 - so prices are down about 35% year-over-year (It was a year ago that prices were falling sharply).
Here is a graph from Gasbuddy.com for nationwide gasoline prices. Nationally prices are at $2.04 per gallon (down about $0.75 per gallon from a year ago).
from Calculated Risk http://ift.tt/1IiADmq
via YQ Matrix
Friday 27 November 2015
Zillow Forecast: Expect October Year-over-year Change for Case-Shiller Index Similar to September
The Case-Shiller house price indexes for September were released on Tuesday. Zillow forecasts Case-Shiller a month early, and I like to check the Zillow forecasts since they have been pretty close.
From Zillow: Case-Shiller Forecast Calls for Similar Annual, Monthly Gains in October

from Calculated Risk http://ift.tt/1NdgZ7f
via YQ Matrix
From Zillow: Case-Shiller Forecast Calls for Similar Annual, Monthly Gains in October
The September S&P Case-Shiller (SPCS) data published [on Tuesday] showed home prices rising on a seasonally-adjusted monthly basis, with month-over-month rises of 0.6 percent for both the 10- and 20- city indices and 0.8 percent for the national index.This suggests the year-over-year change for the October Case-Shiller National index will be about the same as in the September report.
The October Case-Shiller forecast calls for similar monthly increases of 0.4 percent for the 10- and 20-City Indices in October from from September (seasonally adjusted). The national index is expected to gain another 0.8 percent in October from September. We expect the 10-City Index to grow 5 percent year-over-year, and the 20-City Index to grow 5.4 percent over the same period. The national Index looks set to gain 5.1 percent since October 2014.
All SPCS forecasts are shown in the table below. These forecasts are based on today’s September SPCS data release and the October 2015 Zillow Home Value Index (ZHVI), released November 20. The SPCS Composite Home Price Indices for October will not be officially released until Tuesday, December 29.
| Zillow Case-Shiller Forecast | ||||||
|---|---|---|---|---|---|---|
| Case-Shiller Composite 10 |
Case-Shiller Composite 20 |
Case-Shiller National |
||||
| NSA | SA | NSA | SA | NSA | SA | |
| September Actual YoY |
5.0% | 5.0% | 5.5% | 5.5% | 4.9% | 4.9% |
| October Forecast YoY |
5.0% | 5.0% | 5.4% | 5.4% | 5.1% | 5.1% |
| September Forecast MoM |
-0.2% | 0.4% | -0.1% | 0.4% | 0.0% | 0.8% |
from Calculated Risk http://ift.tt/1NdgZ7f
via YQ Matrix
Price Briefing 20 – 26 November
Iodine, magnesia, potash, rare earths and TiO2 prices all down on earlier in the year, as oversupply and weak Chinese consumption erode markets.
from MPW - Pricing News http://ift.tt/1Xv1ihv
via IFTTT
from MPW - Pricing News http://ift.tt/1Xv1ihv
via IFTTT
Wednesday 25 November 2015
2016: Updated Housing Forecasts
Towards the end of each year I collect some housing forecasts for the following year, and it looks like analysts are optimistic for 2016 (many more forecasts will be added).
First a review of the previous three years ...
Here is a summary of forecasts for 2015. In 2015, new home sales will probably be just over 500 thousand, and total housing starts will be something over 1.1 million. It is early, but CoreLogic, Zillow and the MBA were very close on New Home sales, and CoreLogic, MetroStudy, MBA and Zillow were all close on starts.
Here is a summary of forecasts for 2014. In 2014, new home sales were 437 thousand, and total housing starts were 1.003 million. No one was close on New Home sales (all way too optimistic), and Michelle Meyer (Merrill Lynch) and Fannie Mae were the closest on housing starts (about 10% too high). In 2014, many analysts underestimated the impact of higher mortgage rates and higher new home prices on new home sales and starts.
Here is a summary of forecasts for 2013. In 2013, new home sales were 429 thousand, and total housing starts were 925 thousand. Barclays was the closest on New Home sales followed by David Crowe (NAHB). Fannie Mae and the NAHB were the closest on housing starts.
The table below shows a few forecasts for 2016 (I'll add many more of the next several weeks).
From Fannie Mae: Housing Forecast: October 2015
From NAHB: Housing Recovery to Pick Up Steam in 2016, but Challenges Remain
UCLA Ziman Center.
Note: For comparison, new home sales in 2015 will probably be just over 500 thousand, and total housing starts over 1.1 million.
I haven't worked up a forecast yet for 2016, however I think the UCLA forecast for housing starts is too high.

from Calculated Risk http://ift.tt/1Nu3vud
via YQ Matrix
First a review of the previous three years ...
Here is a summary of forecasts for 2015. In 2015, new home sales will probably be just over 500 thousand, and total housing starts will be something over 1.1 million. It is early, but CoreLogic, Zillow and the MBA were very close on New Home sales, and CoreLogic, MetroStudy, MBA and Zillow were all close on starts.
Here is a summary of forecasts for 2014. In 2014, new home sales were 437 thousand, and total housing starts were 1.003 million. No one was close on New Home sales (all way too optimistic), and Michelle Meyer (Merrill Lynch) and Fannie Mae were the closest on housing starts (about 10% too high). In 2014, many analysts underestimated the impact of higher mortgage rates and higher new home prices on new home sales and starts.
Here is a summary of forecasts for 2013. In 2013, new home sales were 429 thousand, and total housing starts were 925 thousand. Barclays was the closest on New Home sales followed by David Crowe (NAHB). Fannie Mae and the NAHB were the closest on housing starts.
The table below shows a few forecasts for 2016 (I'll add many more of the next several weeks).
From Fannie Mae: Housing Forecast: October 2015
From NAHB: Housing Recovery to Pick Up Steam in 2016, but Challenges Remain
UCLA Ziman Center.
Note: For comparison, new home sales in 2015 will probably be just over 500 thousand, and total housing starts over 1.1 million.
I haven't worked up a forecast yet for 2016, however I think the UCLA forecast for housing starts is too high.
| Housing Forecasts for 2016 | ||||
|---|---|---|---|---|
| New Home Sales (000s) | Single Family Starts (000s) | Total Starts (000s) | House Prices1 | |
| Fannie Mae | 562 | 827 | 1,224 | 4.9%2 |
| Merrill Lynch | 555 | 1,275 | 3.0% | |
| MetroStudy | 625 | 820 | 1,235 | 3.1% |
| NAHB | 914 | 1,292 | ||
| UCLA Ziman Center | 1,420 | |||
| 1Case-Shiller unless indicated otherwise 2FHFA Purchase-Only Index |
||||
from Calculated Risk http://ift.tt/1Nu3vud
via YQ Matrix
Philly Fed: State Coincident Indexes increased in 43 states in October
From the Philly Fed:
 Click on graph for larger image.
This is a graph is of the number of states with one month increasing activity according to the Philly Fed. This graph includes states with minor increases (the Philly Fed lists as unchanged).
In October, 44 states had increasing activity (including minor increases).
The worst performing states over the last 6 months are Wisconsin and North Dakota (oil).
 Here is a map of the three month change in the Philly Fed state coincident indicators. This map was all red during the worst of the recession, and is mostly green now.
Source: Philly Fed.
from Calculated Risk http://ift.tt/1OgYnbq
via YQ Matrix
The Federal Reserve Bank of Philadelphia has released the coincident indexes for the 50 states for October 2015. In the past month, the indexes increased in 43 states, decreased in six, and remained stable in one, for a one-month diffusion index of 74. Over the past three months, the indexes increased in 42 states, decreased in seven, and remained stable in one, for a three-month diffusion index of 70.Note: These are coincident indexes constructed from state employment data. An explanation from the Philly Fed:
The coincident indexes combine four state-level indicators to summarize current economic conditions in a single statistic. The four state-level variables in each coincident index are nonfarm payroll employment, average hours worked in manufacturing, the unemployment rate, and wage and salary disbursements deflated by the consumer price index (U.S. city average). The trend for each state’s index is set to the trend of its gross domestic product (GDP), so long-term growth in the state’s index matches long-term growth in its GDP.
This is a graph is of the number of states with one month increasing activity according to the Philly Fed. This graph includes states with minor increases (the Philly Fed lists as unchanged).
In October, 44 states had increasing activity (including minor increases).
The worst performing states over the last 6 months are Wisconsin and North Dakota (oil).
Source: Philly Fed.
from Calculated Risk http://ift.tt/1OgYnbq
via YQ Matrix
From Lashes to Death: Artist Caught in Tangles of Saudi Law
By THE ASSOCIATED PRESS from NYT World http://ift.tt/1MRKDzt
This content was assembled for you by the YQ Matrix platform
The views expressed in this post and throughout the series are the autor's own and not intended to reflect the views the YQ Matrix platform, its users or any associated organisations.
For the procurement people among you, have a look at the latest YQ Matrix raw material and semi-finished prices. For: Prices on other websites.
Shariah Law Key in Palestinian Artist’s Saudi Death Sentence
By THE ASSOCIATED PRESS from NYT World http://ift.tt/1lK0zgA
This content was assembled for you by the YQ Matrix platform
The views expressed in this post and throughout the series are the autor's own and not intended to reflect the views the YQ Matrix platform, its users or any associated organisations.
For the procurement people among you, have a look at the latest YQ Matrix raw material and semi-finished prices. For: Prices on other websites.
City Chefs Gone Country
By HANNAH GOLDFIELD from NYT T Magazine http://ift.tt/1OgwMap
This content was assembled for you by the YQ Matrix platform
The views expressed in this post and throughout the series are the autor's own and not intended to reflect the views the YQ Matrix platform, its users or any associated organisations.
For the procurement people among you, have a look at the latest YQ Matrix raw material and semi-finished prices. For: Prices on other websites.
For the majority of procurement professionals, does technology really matter?
The other day I started to write a post regarding a November 17th, 2015 American Banking & Market News article on Oracle.
Under the headline Oracle Downgraded to “Sell” at Zacks Investment Research (ORCL), the analyst firm offered the following explanation for their assessment:
“Also, the company’s continuing transition from licensing, where revenues are recognized upfront, to a cloud subscription model where it is realized over the years, will hurt its top line in the near term. Stiff competition remains an added concern.”
They then went on to say . . .
“Nevertheless, we believe that rapid adoption of engineered systems and cloud suites will boost top-line growth in 2015 and beyond. In addition, the company’s growth prospects in SaaS, PaaS and Big Data are also encouraging.”
At first the ideas seemed to cascade through my mind with the usual level of excitement that marks the beginnings of a new post. After all, this blog brings together two of my passions – writing and procurement.
Having the opportunity to throw my hat into the ring in terms of offering my two cents in the form of well researched and thoughtful prose, is something I live for.
But a funny thing happened after the first few furious clicks of my keyboard . . . I suddenly stopped and wondered – who really cares about Oracle. For that matter, who cares about technology in general?
I know, I know, technology has been for such a long time an overarching presence – and not just in the procurement world. Even in our personal lives, the ever growing and unstoppable wave of technological evolution is an undeniable constant. From iPads to smart phones to wearable technology, it has permeated all areas of every day life.
But it is in this ubiquity, that the seeds of irrelevance need to be sown.
Think about this last statement for a moment, then look down at your desk and I bet you will see your telephone. How much thought do you give to the technology behind being able to pick up the receiver and dial someone on the other side of the world? Yet when the telephone was first invented and introduced en mass to the world, it was no less revolutionary as the facsimile machine, personal computer or the cloud-based technologies we use today.
Unlike those early adopters, we use the phone without giving it a second thought. It’s like the route we take when we drive home from work . . . we do it so often that we don’t even think about the specific turns we take along the way. We don’t stop to look at our cars before driving and contemplate how it works, we just get in and drive. We simply want the engine to turn over when we turn the key in the ignition, and get home to our lives and all that we hold dear.
Yet here we are – the media that covers the procurement world – force feeding our readers and listeners with inconsequential news about stock prices and Magic Quadrants and everything else in between, when all you want is for everything to work. In short, who really cares about technology. You want to instead focus on the people aspect of your work. The strategies and the day-to-day challenges of human interaction such as building strong relationships with your suppliers as well as members within your own organization.
If technology is to be truly successful, like the telephone, it should be seen (and used) without any real thought. In short, successful technology should simply work, period.
Technology should free you to think and focus on other things as opposed to occupying your time and energy. YOU should be its master as opposed to the other way around, and the Oracles of the world should be your quiet and humble servants, as opposed to occupying the center stage limelight. Like the telephone or the facsimile machine or pen and paper, your procurement technology should be a given.
Maybe this is the greater purpose of the emerging Robotic Process Automation champions, or The Institute For Robotic Process Automation (IRPA). By the way, it is a silly name “Robotic Process Automation,” especially the Robotic part. That said, it would appear that based on a model that has been around for close to 20 years, IRPA’s vision at least captures the spirit of both humble and ubiquitous integration into our daily work lives. Only time will tell.
In the meantime, when it comes to vendors and their solutions, keep the analyst assessments, and Top 50 Suppliers, and the bell ringing proclamations to a minimum, and focus on providing technology that simply and without any fanfare, works.
Or to put it in a less eloquent and more direct fashion . . . just shut up and deliver, and in the process enable me to do a better job without my having to hear and think about you.
30
from Procurement Insights http://ift.tt/1PYV2h8
This content was assembled for you by the YQ Matrix platform
The views expressed in this post and throughout the series are the autor's own and not intended to reflect the views the YQ Matrix platform, its users or any associated organisations.
For the procurement people among you, have a look at the latest YQ Matrix raw material and semi-finished prices. For: Prices on other websites.
Personal Income increased 0.4% in October, Spending increased 0.1%
The BEA released the Personal Income and Outlays report for October:
 Click on graph for larger image.
The dashed red lines are the quarterly levels for real PCE.
The increase in personal income was at consensus expectations. And the increase in PCE was below the consensus.
On inflation: The PCE price index increased 0.2 percent year-over-year due to the sharp decline in oil prices. The core PCE price index (excluding food and energy) increased 1.3 percent year-over-year in October.
from Calculated Risk http://ift.tt/1jjpQMS
via YQ Matrix
Personal income increased $68.1 billion, or 0.4 percent ... in October, according to the Bureau of Economic Analysis. Personal consumption expenditures (PCE) increased $15.2 billion, or 0.1 percent.The following graph shows real Personal Consumption Expenditures (PCE) through October 2015 (2009 dollars). Note that the y-axis doesn't start at zero to better show the change.
...
Real PCE -- PCE adjusted to remove price changes -- increased 0.1 percent in October, the same increase as in September. ... The price index for PCE increased 0.1 percent in October, in contrast to a decrease of 0.1 percent in September. The PCE price index, excluding food and energy, increased less than 0.1 percent, compared to an increase of 0.2 percent.
The October price index for PCE increased 0.2 percent from October a year ago. The October PCE price index, excluding food and energy, increased 1.3 percent from October a year ago.
The dashed red lines are the quarterly levels for real PCE.
The increase in personal income was at consensus expectations. And the increase in PCE was below the consensus.
On inflation: The PCE price index increased 0.2 percent year-over-year due to the sharp decline in oil prices. The core PCE price index (excluding food and energy) increased 1.3 percent year-over-year in October.
from Calculated Risk http://ift.tt/1jjpQMS
via YQ Matrix
Rare earths prices fall back after rally
Lanthanum and europium prices sink while dysprosium and mixed magnet oxides fare better.
from MPW - Pricing News http://ift.tt/1PO59qw
via IFTTT
from MPW - Pricing News http://ift.tt/1PO59qw
via IFTTT
CCM prices from China slip in flat market
Soft refractories demand is reported to be eroding prices for caustic calcined magnesia.
from MPW - Pricing News http://ift.tt/1PNUCM3
via IFTTT
from MPW - Pricing News http://ift.tt/1PNUCM3
via IFTTT
Tuesday 24 November 2015
Wednesday: New Home Sales, Unemployment Claims, Personal Income and Outlays, Durable Goods, and more
From the WSJ: Real Home Prices Could Take 17 Years to Return to Peak
This is important. As I wrote in early 2005, "a bubble requires both overvaluation based on fundamentals and speculation", and currently we are seeing little speculation and valuations aren't anything like during the bubble. So no bubble.
The WSJ article quotes Corelogic chief economist Sam Khater:
• 7:00 AM ET: the Mortgage Bankers Association (MBA) will release the results for the mortgage purchase applications index.
• At 8:30 AM, the initial weekly unemployment claims report will be released. The consensus is for 270 thousand initial claims, down from 271 thousand the previous week.
• Also at 8:30 AM, Durable Goods Orders for October from the Census Bureau. The consensus is for a 1.5% decrease in durable goods orders.
• Also at 8:30 AM, Personal Income and Outlays for October. The consensus is for a 0.4% increase in personal income, and for a 0.3% increase in personal spending. And for the Core PCE price index to increase 0.2%.
• At 9:00 AM, the FHFA House Price Index for September 2015. This was originally a GSE only repeat sales, however there is also an expanded index. The consensus is for a 0.4% month-to-month increase for this index.
• At 10:00 AM, New Home Sales for October from the Census Bureau. The consensus is for a increase in sales to 499 thousand Seasonally Adjusted Annual Rate (SAAR) in October from 468 thousand in September.
• Also at 10:00 AM, the University of Michigan's Consumer sentiment index (final for November). The consensus is for a reading of 93.1, unchanged from the preliminary reading.
from Calculated Risk http://ift.tt/1R5MR3v
via YQ Matrix
Most measures of home prices—including the S&P/Case-Shiller Home Price Index, the CoreLogic Home Price Index and the National Association of Realtors existing home sales report—don’t take inflation into account and show prices nearing or surpassing the peak hit in 2006 or early 2007.As the article notes, the nominal Corelogic index is 7% below the peak, but 20% below the peak when adjusted for inflation. As I noted this morning, the nominal Case-Shiller index 6% below the bubble, but 19.7% below the peak when adjusted for inflation.
But a new analysis by real-estate information firm CoreLogic finds that when adjusted for inflation, home prices are years away from hitting the lofty heights of the housing boom. Indeed, economists there say that prices are unlikely to surpass 2006 levels until 2023 or beyond, some 17 years past the peak.
This is important. As I wrote in early 2005, "a bubble requires both overvaluation based on fundamentals and speculation", and currently we are seeing little speculation and valuations aren't anything like during the bubble. So no bubble.
The WSJ article quotes Corelogic chief economist Sam Khater:
“The market is overvalued but it’s not a bubble,” Mr. Khater said. “Unlike the last boom, which was heavily demand-driven, this boom [in] home prices is driven by the chronic lack of supply.”Wednesday:
• 7:00 AM ET: the Mortgage Bankers Association (MBA) will release the results for the mortgage purchase applications index.
• At 8:30 AM, the initial weekly unemployment claims report will be released. The consensus is for 270 thousand initial claims, down from 271 thousand the previous week.
• Also at 8:30 AM, Durable Goods Orders for October from the Census Bureau. The consensus is for a 1.5% decrease in durable goods orders.
• Also at 8:30 AM, Personal Income and Outlays for October. The consensus is for a 0.4% increase in personal income, and for a 0.3% increase in personal spending. And for the Core PCE price index to increase 0.2%.
• At 9:00 AM, the FHFA House Price Index for September 2015. This was originally a GSE only repeat sales, however there is also an expanded index. The consensus is for a 0.4% month-to-month increase for this index.
• At 10:00 AM, New Home Sales for October from the Census Bureau. The consensus is for a increase in sales to 499 thousand Seasonally Adjusted Annual Rate (SAAR) in October from 468 thousand in September.
• Also at 10:00 AM, the University of Michigan's Consumer sentiment index (final for November). The consensus is for a reading of 93.1, unchanged from the preliminary reading.
from Calculated Risk http://ift.tt/1R5MR3v
via YQ Matrix
Real Prices and Price-to-Rent Ratio in September
Here is the earlier post on Case-Shiller: Case-Shiller: National House Price Index increased 4.9% year-over-year in September
The year-over-year increase in prices is mostly moving sideways now at between 4% and 5%. In October 2013, the National index was up 10.9% year-over-year (YoY). In September 2015, the index was up 4.9% YoY.
Here is the YoY change since January 2014 for the National Index:
This slowdown in price increases this year was expected by several key analysts, and I think it is good news for housing and the economy.
In the earlier post, I graphed nominal house prices, but it is also important to look at prices in real terms (inflation adjusted). Case-Shiller, CoreLogic and others report nominal house prices. As an example, if a house price was $200,000 in January 2000, the price would be close to $274,000 today adjusted for inflation (37%). That is why the second graph below is important - this shows "real" prices (adjusted for inflation).
It has been almost ten years since the bubble peak. In the Case-Shiller release this morning, the National Index was reported as being 6.0% below the bubble peak. However, in real terms, the National index is still about 19.7% below the bubble peak.
Nominal House Prices
 The first graph shows the monthly Case-Shiller National Index SA, the monthly Case-Shiller Composite 20 SA, and the CoreLogic House Price Indexes (through September) in nominal terms as reported.
In nominal terms, the Case-Shiller National index (SA) is back to August 2005 levels, and the Case-Shiller Composite 20 Index (SA) is back to February 2005 levels, and the CoreLogic index (NSA) is back to June 2005.
Real House Prices
 The second graph shows the same three indexes in real terms (adjusted for inflation using CPI less Shelter). Note: some people use other inflation measures to adjust for real prices.
In real terms, the National index is back to September 2003 levels, the Composite 20 index is back to May 2003, and the CoreLogic index back to January 2004.
In real terms, house prices are back to 2003 levels.
Note: CPI less Shelter is down 1.5% year-over-year, so this is pushing up real prices.
Price-to-Rent
In October 2004, Fed economist John Krainer and researcher Chishen Wei wrote a Fed letter on price to rent ratios: House Prices and Fundamental Value. Kainer and Wei presented a price-to-rent ratio using the OFHEO house price index and the Owners' Equivalent Rent (OER) from the BLS.
 Here is a similar graph using the Case-Shiller National, Composite 20 and CoreLogic House Price Indexes.
This graph shows the price to rent ratio (January 1998 = 1.0).
On a price-to-rent basis, the Case-Shiller National index is back to May 2003 levels, the Composite 20 index is back to December 2002 levels, and the CoreLogic index is back to October 2003.
In real terms, and as a price-to-rent ratio, prices are back to 2003 levels - and the price-to-rent ratio maybe moving a little sideways now.
from Calculated Risk http://ift.tt/1I8EFxr
via YQ Matrix
The year-over-year increase in prices is mostly moving sideways now at between 4% and 5%. In October 2013, the National index was up 10.9% year-over-year (YoY). In September 2015, the index was up 4.9% YoY.
Here is the YoY change since January 2014 for the National Index:
| Month | YoY Change |
|---|---|
| Jan-14 | 10.5% |
| Feb-14 | 10.1% |
| Mar-14 | 8.9% |
| Apr-14 | 7.9% |
| May-14 | 7.1% |
| Jun-14 | 6.3% |
| Jul-14 | 5.7% |
| Aug-14 | 5.1% |
| Sep-14 | 4.8% |
| Oct-14 | 4.6% |
| Nov-14 | 4.6% |
| Dec-14 | 4.6% |
| Jan-15 | 4.3% |
| Feb-15 | 4.3% |
| Mar-15 | 4.3% |
| Apr-15 | 4.3% |
| May-15 | 4.4% |
| Jun-15 | 4.4% |
| Jul-15 | 4.5% |
| Aug-15 | 4.6% |
| Sep-15 | 4.9% |
This slowdown in price increases this year was expected by several key analysts, and I think it is good news for housing and the economy.
In the earlier post, I graphed nominal house prices, but it is also important to look at prices in real terms (inflation adjusted). Case-Shiller, CoreLogic and others report nominal house prices. As an example, if a house price was $200,000 in January 2000, the price would be close to $274,000 today adjusted for inflation (37%). That is why the second graph below is important - this shows "real" prices (adjusted for inflation).
It has been almost ten years since the bubble peak. In the Case-Shiller release this morning, the National Index was reported as being 6.0% below the bubble peak. However, in real terms, the National index is still about 19.7% below the bubble peak.
Nominal House Prices
In nominal terms, the Case-Shiller National index (SA) is back to August 2005 levels, and the Case-Shiller Composite 20 Index (SA) is back to February 2005 levels, and the CoreLogic index (NSA) is back to June 2005.
Real House Prices
In real terms, the National index is back to September 2003 levels, the Composite 20 index is back to May 2003, and the CoreLogic index back to January 2004.
In real terms, house prices are back to 2003 levels.
Note: CPI less Shelter is down 1.5% year-over-year, so this is pushing up real prices.
Price-to-Rent
In October 2004, Fed economist John Krainer and researcher Chishen Wei wrote a Fed letter on price to rent ratios: House Prices and Fundamental Value. Kainer and Wei presented a price-to-rent ratio using the OFHEO house price index and the Owners' Equivalent Rent (OER) from the BLS.
This graph shows the price to rent ratio (January 1998 = 1.0).
On a price-to-rent basis, the Case-Shiller National index is back to May 2003 levels, the Composite 20 index is back to December 2002 levels, and the CoreLogic index is back to October 2003.
In real terms, and as a price-to-rent ratio, prices are back to 2003 levels - and the price-to-rent ratio maybe moving a little sideways now.
from Calculated Risk http://ift.tt/1I8EFxr
via YQ Matrix
Case-Shiller: National House Price Index increased 4.9% year-over-year in September
S&P/Case-Shiller released the monthly Home Price Indices for September ("September" is a 3 month average of July, August and September prices).
This release includes prices for 20 individual cities, two composite indices (for 10 cities and 20 cities) and the monthly National index.
Note: Case-Shiller reports Not Seasonally Adjusted (NSA), I use the SA data for the graphs.
From S&P: Widespread Gains in Home Prices for August According to the S&P/Case-Shiller Home Price Indices
 Click on graph for larger image.
The first graph shows the nominal seasonally adjusted Composite 10, Composite 20 and National indices (the Composite 20 was started in January 2000).
The Composite 10 index is off 14.3% from the peak, and up 0.6% in September (SA).
The Composite 20 index is off 13.0% from the peak, and up 0.6% (SA) in September.
The National index is off 6.0% from the peak, and up 0.8% (SA) in September. The National index is up 27.0% from the post-bubble low set in December 2011 (SA).
 The second graph shows the Year over year change in all three indices.
The Composite 10 SA is up 5.1% compared to September 2014.
The Composite 20 SA is up 5.5% year-over-year..
The National index SA is up 4.9% year-over-year.
Prices increased (SA) in 20 of the 20 Case-Shiller cities in September seasonally adjusted. (Prices increased in 15 of the 20 cities NSA) Prices in Las Vegas are off 39.2% from the peak, and prices in Denver and Dallas are at new highs (SA).
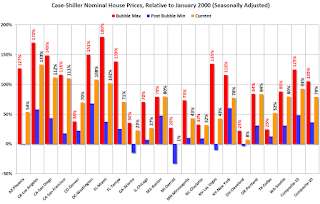 The last graph shows the bubble peak, the post bubble minimum, and current nominal prices relative to January 2000 prices for all the Case-Shiller cities in nominal terms.
As an example, at the peak, prices in Phoenix were 127% above the January 2000 level. Then prices in Phoenix fell slightly below the January 2000 level, and are now up 54% above January 2000 (54% nominal gain in almost 16 years).
These are nominal prices, and real prices (adjusted for inflation) are up about 40% since January 2000 - so the increase in Phoenix from January 2000 until now is about 14% above the change in overall prices due to inflation.
Three cities - Denver (up 70% since Jan 2000) and Dallas (up 52% since Jan 2000) and Boston (up 80% since Jan 2000) - are above the bubble highs (a few other Case-Shiller Comp 20 city are close - Charlotte, San Francisco, Portland and Seattle). Detroit prices are barely above the January 2000 level.
I'll have more on house prices later.
from Calculated Risk http://ift.tt/1XbWxOX
via YQ Matrix
This release includes prices for 20 individual cities, two composite indices (for 10 cities and 20 cities) and the monthly National index.
Note: Case-Shiller reports Not Seasonally Adjusted (NSA), I use the SA data for the graphs.
From S&P: Widespread Gains in Home Prices for August According to the S&P/Case-Shiller Home Price Indices
The S&P/Case-Shiller U.S. National Home Price Index, covering all nine U.S. census divisions, recorded a slightly higher year-over-year gain with a 4.9% annual increase in September 2015 versus a 4.6% increase in August 2015. The 10-City Composite increased 5.0% in the year to September compared to 4.7% previously. The 20-City Composite’s year-over-year gain was 5.5% versus 5.1% in the year to September. After adjusting for the CPI core rate of inflation, the S&P/Case Shiller National Home Price Index rose 3% from September 2014 to September 2015.
...
Before seasonal adjustment, the National Index posted a gain of 0.2% month-over-month in September. The 10-City Composite and 20-City Composite both reported gains of 0.2% month-over-month in September. After seasonal adjustment, the National Index posted a gain of 0.8%, while the 10-City and 20-City Composites both increased 0.6% month-over-month. Fifteen of 20 cities reported increases in September before seasonal adjustment; after seasonal adjustment, 19 cities increased for the month.
...
“Home prices and housing continue to show strength with home prices rising at more than double the rate of inflation,” says David M. Blitzer, Managing Director and Chairman of the Index Committee at S&P Dow Jones Indices
emphasis added
The first graph shows the nominal seasonally adjusted Composite 10, Composite 20 and National indices (the Composite 20 was started in January 2000).
The Composite 10 index is off 14.3% from the peak, and up 0.6% in September (SA).
The Composite 20 index is off 13.0% from the peak, and up 0.6% (SA) in September.
The National index is off 6.0% from the peak, and up 0.8% (SA) in September. The National index is up 27.0% from the post-bubble low set in December 2011 (SA).
The Composite 10 SA is up 5.1% compared to September 2014.
The Composite 20 SA is up 5.5% year-over-year..
The National index SA is up 4.9% year-over-year.
Prices increased (SA) in 20 of the 20 Case-Shiller cities in September seasonally adjusted. (Prices increased in 15 of the 20 cities NSA) Prices in Las Vegas are off 39.2% from the peak, and prices in Denver and Dallas are at new highs (SA).
As an example, at the peak, prices in Phoenix were 127% above the January 2000 level. Then prices in Phoenix fell slightly below the January 2000 level, and are now up 54% above January 2000 (54% nominal gain in almost 16 years).
These are nominal prices, and real prices (adjusted for inflation) are up about 40% since January 2000 - so the increase in Phoenix from January 2000 until now is about 14% above the change in overall prices due to inflation.
Three cities - Denver (up 70% since Jan 2000) and Dallas (up 52% since Jan 2000) and Boston (up 80% since Jan 2000) - are above the bubble highs (a few other Case-Shiller Comp 20 city are close - Charlotte, San Francisco, Portland and Seattle). Detroit prices are barely above the January 2000 level.
I'll have more on house prices later.
from Calculated Risk http://ift.tt/1XbWxOX
via YQ Matrix
Q3 GDP Revised Up to 2.1% Annual Rate
From the BEA: Gross Domestic Product: Third Quarter 2015 (Second Estimate)

from Calculated Risk http://ift.tt/1OpTESZ
via YQ Matrix
Real gross domestic product -- the value of the goods and services produced by the nation’s economy less the value of the goods and services used up in production, adjusted for price changes -- increased at an annual rate of 2.1 percent in the third quarter of 2015, according to the "second" estimate released by the Bureau of Economic Analysis. In the second quarter, real GDP increased 3.9 percent.Here is a Comparison of Second and Advance Estimates. PCE growth was revised down from 3.2% to 3.0%. Residential investment was revised up from 6.1% to 7.3%.
The GDP estimate released today is based on more complete source data than were available for the "advance" estimate issued last month. In the advance estimate, the increase in real GDP was 1.5 percent. With the second estimate for the third quarter, the decrease in private inventory investment was smaller than previously estimated ...
emphasis added
from Calculated Risk http://ift.tt/1OpTESZ
via YQ Matrix
Monday 23 November 2015
Tuesday: GDP, Case-Shiller House Prices
A couple of people were too kind today:
From Paul Krugman: Shorts Subject
And from Joseph Weisenthal at Bloomberg: Bloomberg TV’s What’d You Miss? thinks of linear TV as “a source of content for online video”
Tuesday:
• 8:30 AM ET: Gross Domestic Product, 3rd quarter 2015 (Second estimate). The consensus is that real GDP increased 2.1% annualized in Q3, revised up from the advance estimate of 1.5%.
• At 9:00 AM, S&P/Case-Shiller House Price Index for September. Although this is the September report, it is really a 3 month average of July, August and September prices. The consensus is for a 5.3% year-over-year increase in the Comp 20 index for September. The Zillow forecast is for the National Index to increase 4.7% year-over-year in September.
• At 10:00 AM, the Richmond Fed Survey of Manufacturing Activity for November
from Calculated Risk http://ift.tt/1NMglhE
via YQ Matrix
From Paul Krugman: Shorts Subject
Last night I was invited to a screening of The Big Short, which I thought was terrific; who knew that CDOs and credit default swaps could be made into an edge-of-your-seat narrative (with great acting)?I'm looking forward to seeing the movie.
And from Joseph Weisenthal at Bloomberg: Bloomberg TV’s What’d You Miss? thinks of linear TV as “a source of content for online video”
This guy in California named Bill McBride who runs a blog called Calculated Risk. He was one of the best and greatest chroniclers of the housing market. He was talking about how the housing market was really in trouble as early as 2005. His blog was a must-read. On the way down, he also nailed the situation perfectly. And then, unlike a lot of the people who were calling for doom and gloom in 2009 and 2010, he started talking about the rebound of the economy.Thank you. My co-blogger during the bubble, Doris "Tanta" Dungey, always blushed when people said nice things about her - and it happened frequently to her. As an aside, Tanta's birthday was Nov 15th and she would have been 54. When people mention that time period, I always think of "T". Tanta Vive!
Tuesday:
• 8:30 AM ET: Gross Domestic Product, 3rd quarter 2015 (Second estimate). The consensus is that real GDP increased 2.1% annualized in Q3, revised up from the advance estimate of 1.5%.
• At 9:00 AM, S&P/Case-Shiller House Price Index for September. Although this is the September report, it is really a 3 month average of July, August and September prices. The consensus is for a 5.3% year-over-year increase in the Comp 20 index for September. The Zillow forecast is for the National Index to increase 4.7% year-over-year in September.
• At 10:00 AM, the Richmond Fed Survey of Manufacturing Activity for November
from Calculated Risk http://ift.tt/1NMglhE
via YQ Matrix
Would 50% of all procurement professionals really choose a different career?
At a conference at which I was speaking, I posed the question how many of you in the audience chose procurement as a profession? Specifically, did you consciously say I want to be in purchasing or, did you just sort of fall into it?
Not surprisingly, the vast majority indicated that they just sort of ended up in purchasing as opposed to choosing it as a career.
I then asked, if you had to do it all over again, how many would have made the decision to pursue another career path. Or to put it another way, how many would have made the decision to chose a career other than procurement.
50% responded that they would in fact have pursued a career path other than procurement.
What is even more notable, is that the response was almost identical with another audience of similar size, during a different session.
While somewhat surprising, the above revelations were also quite disconcerting.
In an effort to get a better understanding of what this 50% actually means, I did some research into what I will call the discontentment factor, in other professions.
For example, a January 11th, 2015 Forbes article titled 1 In 4 New Doctors Would Change Careers If They Could Start Over, reported that 25% of new physicians would choose another field if they could. The reason given as being “paramount” for their second thoughts, centered around whether or not they would “have a life” outside of the profession.
In addition to the above findings, the article also refers to a 2015 survey of residents in their final year, in which said residents indicated that they would rather go for the security of a 9 to 5 employment position with a salary, as opposed to launching their own private practices.
Given that procurement professionals are for the most part working in a 9 to 5 capacity and, have an employment salary, the 50% figure is even more perplexing.
If job security is not the issue with procurement pros, then what is?
When I asked those in the audience why they would choose a different career path, one of the more prevalent answers I received was the feeling that their contributions did not make a difference. There were also those from within the public sector who expressed frustration with the bureaucracy that, for the most part, prevented them from doing what they believed was the best job possible.
Once again, a certain level of job dissatisfaction within any sector is nothing new. However, the 50% number should be of concern to those occupying the executive suite both within, and external to the procurement industry. After all, it is hard to operate at maximum capacity when half your team is disenchanted and/or disengaged.
Besides ascertaining if there is a general malaise across the board -or if the response was an unusual blip that was confined to these specific audiences, another important question that needs to be asked (and answered) is simply this; what has to be done going forward?
This is a particularly important question given the up and coming generation’s mobility i.e. willingness to change jobs or even careers.
The fact is that if 50% of those in our profession regret their being in it, industry leaders have to find a way to either reengage and re-energize this group, or move to replace them. Of course the latter only makes sense if in replacing them, they understand why the other 50% are satisfied with their career choice, and seek to hire those who fall into this category.
30
from Procurement Insights http://ift.tt/1No8z39
This content was assembled for you by the YQ Matrix platform
The views expressed in this post and throughout the series are the autor's own and not intended to reflect the views the YQ Matrix platform, its users or any associated organisations.
For the procurement people among you, have a look at the latest YQ Matrix raw material and semi-finished prices. For: Prices on other websites.
A Few Random Comments on October Existing Home Sales
Earlier: Existing Home Sales in October: 5.36 million SAAR
I expected some increase in inventory this year, but that hasn't happened. Inventory is still very low and falling year-over-year (down 4.5% year-over-year in September). More inventory would probably mean smaller price increases and slightly higher sales, and less inventory means lower sales and somewhat larger price increases.
It would seem if we do see lower sales - and higher prices - that should eventually lead to more inventory. So far the opposite has been true.
Also, if sales do slow, it is important to remember that new home sales are more important for jobs and the economy than existing home sales. Since existing sales are existing stock, the only direct contribution to GDP is the broker's commission. There is usually some additional spending with an existing home purchase - new furniture, etc - but overall the economic impact is small compared to a new home sale. So some slowing for existing home sales (if it happens) will not be a big deal for the economy.
Also, the NAR reported distressed sales declined further year-over-year and are now at the lowest level since the NAR started tracking distressed sales in 2008:
 Click on graph for larger image.
Sales NSA in October (red column) were the highest for October since 2006 (NSA).
from Calculated Risk http://ift.tt/1SfxZ10
via YQ Matrix
I expected some increase in inventory this year, but that hasn't happened. Inventory is still very low and falling year-over-year (down 4.5% year-over-year in September). More inventory would probably mean smaller price increases and slightly higher sales, and less inventory means lower sales and somewhat larger price increases.
It would seem if we do see lower sales - and higher prices - that should eventually lead to more inventory. So far the opposite has been true.
Also, if sales do slow, it is important to remember that new home sales are more important for jobs and the economy than existing home sales. Since existing sales are existing stock, the only direct contribution to GDP is the broker's commission. There is usually some additional spending with an existing home purchase - new furniture, etc - but overall the economic impact is small compared to a new home sale. So some slowing for existing home sales (if it happens) will not be a big deal for the economy.
Also, the NAR reported distressed sales declined further year-over-year and are now at the lowest level since the NAR started tracking distressed sales in 2008:
Distressed sales – foreclosures and short sales – declined to 6 percent in October, which is the lowest since NAR began tracking in October 2008; they were 9 percent a year ago. Five percent of October sales were foreclosures and 1 percent were short sales.The following graph shows existing home sales Not Seasonally Adjusted (NSA).
Sales NSA in October (red column) were the highest for October since 2006 (NSA).
from Calculated Risk http://ift.tt/1SfxZ10
via YQ Matrix
China’s TiO2 prices have declined by around $400/tonne since mid-year peaks
: Domestic prices sag as export demand dries up and overcapacity weighs on market.
from MPW - Pricing News http://ift.tt/1jgd55C
via IFTTT
from MPW - Pricing News http://ift.tt/1jgd55C
via IFTTT
Nestle Confirms Labor Abuse Among Its Thai Seafood Suppliers
By THE ASSOCIATED PRESS from NYT U.S. http://ift.tt/1N978ne
This content was assembled for you by the YQ Matrix platform
The views expressed in this post and throughout the series are the autor's own and not intended to reflect the views the YQ Matrix platform, its users or any associated organisations.
For the procurement people among you, have a look at the latest YQ Matrix raw material and semi-finished prices. For: Prices on other websites.
Warburg Pincus Closes $12 Billion Fund, Its Biggest Since the Crisis
By LESLIE PICKER from NYT Business Day http://ift.tt/1MMUo1Y
This content was assembled for you by the YQ Matrix platform
The views expressed in this post and throughout the series are the autor's own and not intended to reflect the views the YQ Matrix platform, its users or any associated organisations.
For the procurement people among you, have a look at the latest YQ Matrix raw material and semi-finished prices. For: Prices on other websites.
Sunday 22 November 2015
Monday: Existing Home Sales
An excerpt from a Tim Duy piece at Fed Watch: Mission Accomplished
• At 8:30 AM ET, the Chicago Fed National Activity Index for October. This is a composite index of other data.
• At 10:00 AM, Existing Home Sales for October from the National Association of Realtors (NAR). The consensus is for 5.41 million SAAR, down from 5.55 million in September. Economist Tom Lawler estimates the NAR will report sales of 5.33 million SAAR.
Weekend:
• Schedule for Week of November 22, 2015
From CNBC: Pre-Market Data and Bloomberg futures: currently S&P futures are up 5 and DOW futures are up 40 (fair value).
Oil prices were up over the last week with WTI futures at $41.59 per barrel and Brent at $44.50 per barrel. A year ago, WTI was at $75, and Brent was at $77 - so prices are down about 40% year-over-year (It was a year ago that prices were falling sharply).
Here is a graph from Gasbuddy.com for nationwide gasoline prices. Nationally prices are at $2.08 per gallon (down about $0.75 per gallon from a year ago).
from Calculated Risk http://ift.tt/1QCI5LH
via YQ Matrix
Bottom Line: The Fed is set to declare “Mission Accomplished” at the next FOMC meeting. Indeed, many policymakers have already said as much. Absent a very significant change in the outlook, failure to hike rates in December would renew the barrage of criticism regarding their communications strategy that prompted them to highlight the December meeting in their last statement. Once they have communicated their intentions for subsequent rate hikes, they will turn their attention to the issue of normalizing the balance sheet. Even though officials have not committed to a specific path, I am working with a baseline of 100bp of tightening between now and next December, or roughly 25bp every other meeting. I expect that by the second quarter of next year they will begin communicating the fate of the balance sheet. Whether they should hike or not remains a separate issue. Over the next twelve months we will learn the extent of which the Federal Reserve can resist the global downward pull of interest rates. Other central banks have been less-than-successful in their efforts to pull off of the zero bound – not exactly a hopeful precedent.Monday:
• At 8:30 AM ET, the Chicago Fed National Activity Index for October. This is a composite index of other data.
• At 10:00 AM, Existing Home Sales for October from the National Association of Realtors (NAR). The consensus is for 5.41 million SAAR, down from 5.55 million in September. Economist Tom Lawler estimates the NAR will report sales of 5.33 million SAAR.
Weekend:
• Schedule for Week of November 22, 2015
From CNBC: Pre-Market Data and Bloomberg futures: currently S&P futures are up 5 and DOW futures are up 40 (fair value).
Oil prices were up over the last week with WTI futures at $41.59 per barrel and Brent at $44.50 per barrel. A year ago, WTI was at $75, and Brent was at $77 - so prices are down about 40% year-over-year (It was a year ago that prices were falling sharply).
Here is a graph from Gasbuddy.com for nationwide gasoline prices. Nationally prices are at $2.08 per gallon (down about $0.75 per gallon from a year ago).
from Calculated Risk http://ift.tt/1QCI5LH
via YQ Matrix
Analysts: Q3 GDP to be Revised Up
Note: The second estimate of Q3 GDP will be released on Tuesday. The consensus is that real GDP increased 2.1% annualized in Q3, revised up from the advance estimate of 1.5%. Note that domestic demand was solid in Q3, and that the weakness was mostly due to changes in inventory.
Merrill Lynch on GDP revision:

from Calculated Risk http://ift.tt/1Nl7lFR
via YQ Matrix
Merrill Lynch on GDP revision:
In the second release of 3Q GDP, we expect growth to be revised up to 2.1% qoq saar from the preliminary estimate of 1.5%. Inventories will be the primary driver, as stronger-than-anticipated September data revealed less inventory drawdown than initially assumed. Instead of a 1.4pp drag on 3Q growth, inventories will likely have a negative contribution closer to 0.8pp. Elsewhere, consumer spending and residential investment will likely be revised up, while structures investment should head lower. Advance trade data released at the same time as GDP may contain revisions to 3Q, so there is some uncertainty in our forecast.And from Nomura:
We expect the GDP price index to be unrevised at 1.2% qoq, with the core PCE price index similarly unrevised at 1.3%.
We expect Q3 GDP to be revised up by 0.9pp in its second estimate to 2.4% from 1.5%. We expect the upward revision to be primarily due to stronger-than-assumed inventory investment. Domestic demand in the aggregate should remain roughly unchanged, as upward revisions to government spending and residential fixed investment were likely countered by weaker-than-expected business investment. We expect final sales growth to remain at 3.0% and forecast that inventory investment will subtract 0.6pp from growth compared with the assumed 1.4pp previously.
from Calculated Risk http://ift.tt/1Nl7lFR
via YQ Matrix
ASEAN Establishes Landmark Economic and Security Bloc
By REUTERS from NYT World http://ift.tt/1Hg2D9X
This content was assembled for you by the YQ Matrix platform
The views expressed in this post and throughout the series are the autor's own and not intended to reflect the views the YQ Matrix platform, its users or any associated organisations.
For the procurement people among you, have a look at the latest YQ Matrix raw material and semi-finished prices. For: Prices on other websites.
Saturday 21 November 2015
ASEAN Creates 'Community' at Summit Shadowed by Terrorism Worries
By REUTERS from NYT World http://ift.tt/1PFu2VB
This content was assembled for you by the YQ Matrix platform
The views expressed in this post and throughout the series are the autor's own and not intended to reflect the views the YQ Matrix platform, its users or any associated organisations.
For the procurement people among you, have a look at the latest YQ Matrix raw material and semi-finished prices. For: Prices on other websites.
Schedule for Week of November 22nd
This will be a short, but busy holiday week.
The key reports this week are the second estimate of Q3 GDP, October New Home sales, October Existing Home Sales, October personal income and outlays, and September Case-Shiller house prices.
----- Monday, November 23rd -----
8:30 AM ET: Chicago Fed National Activity Index for October. This is a composite index of other data.
 10:00 AM: Existing Home Sales for October from the National Association of Realtors (NAR). The consensus is for 5.41 million SAAR, down from 5.55 million in September.
Economist Tom Lawler estimates the NAR will report sales of 5.33 million SAAR.
A key will be the reported year-over-year change in inventory of homes for sale.
----- Tuesday, November 24th -----
8:30 AM ET: Gross Domestic Product, 3rd quarter 2015 (Second estimate). The consensus is that real GDP increased 2.1% annualized in Q3, revised up from the advance estimate of 1.5%.
 9:00 AM: S&P/Case-Shiller House Price Index for September. Although this is the September report, it is really a 3 month average of July, August and September prices.
This graph shows the nominal seasonally adjusted National Index, Composite 10 and Composite 20 indexes through the August 2015 report (the Composite 20 was started in January 2000).
The consensus is for a 5.3% year-over-year increase in the Comp 20 index for September. The Zillow forecast is for the National Index to increase 4.7% year-over-year in September.
10:00 AM: Richmond Fed Survey of Manufacturing Activity for November.
----- Wednesday, November 25th -----
7:00 AM ET: The Mortgage Bankers Association (MBA) will release the results for the mortgage purchase applications index.
8:30 AM: The initial weekly unemployment claims report will be released. The consensus is for 270 thousand initial claims, down from 271 thousand the previous week.
8:30 AM: Durable Goods Orders for October from the Census Bureau. The consensus is for a 1.5% decrease in durable goods orders.
8:30 AM ET: Personal Income and Outlays for October. The consensus is for a 0.4% increase in personal income, and for a 0.3% increase in personal spending. And for the Core PCE price index to increase 0.2%.
9:00 AM: FHFA House Price Index for September 2015. This was originally a GSE only repeat sales, however there is also an expanded index. The consensus is for a 0.4% month-to-month increase for this index.
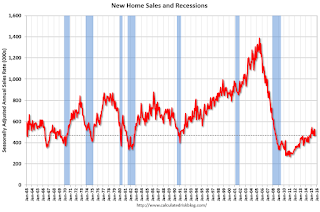 10:00 AM: New Home Sales for October from the Census Bureau.
This graph shows New Home Sales since 1963. The dashed line is the August sales rate.
The consensus is for a increase in sales to 499 thousand Seasonally Adjusted Annual Rate (SAAR) in October from 468 thousand in September.
10:00 AM: University of Michigan's Consumer sentiment index (final for November). The consensus is for a reading of 93.1, unchanged from the preliminary reading.
----- Thursday, November 26th -----
All US markets will be closed in observance of the Thanksgiving Day Holiday.
----- Friday, November 27th -----
The NYSE and the NASDAQ will close at 1:00 PM ET.
from Calculated Risk http://ift.tt/1YmdNy3
via YQ Matrix
The key reports this week are the second estimate of Q3 GDP, October New Home sales, October Existing Home Sales, October personal income and outlays, and September Case-Shiller house prices.
8:30 AM ET: Chicago Fed National Activity Index for October. This is a composite index of other data.
Economist Tom Lawler estimates the NAR will report sales of 5.33 million SAAR.
A key will be the reported year-over-year change in inventory of homes for sale.
8:30 AM ET: Gross Domestic Product, 3rd quarter 2015 (Second estimate). The consensus is that real GDP increased 2.1% annualized in Q3, revised up from the advance estimate of 1.5%.
This graph shows the nominal seasonally adjusted National Index, Composite 10 and Composite 20 indexes through the August 2015 report (the Composite 20 was started in January 2000).
The consensus is for a 5.3% year-over-year increase in the Comp 20 index for September. The Zillow forecast is for the National Index to increase 4.7% year-over-year in September.
10:00 AM: Richmond Fed Survey of Manufacturing Activity for November.
7:00 AM ET: The Mortgage Bankers Association (MBA) will release the results for the mortgage purchase applications index.
8:30 AM: The initial weekly unemployment claims report will be released. The consensus is for 270 thousand initial claims, down from 271 thousand the previous week.
8:30 AM: Durable Goods Orders for October from the Census Bureau. The consensus is for a 1.5% decrease in durable goods orders.
8:30 AM ET: Personal Income and Outlays for October. The consensus is for a 0.4% increase in personal income, and for a 0.3% increase in personal spending. And for the Core PCE price index to increase 0.2%.
9:00 AM: FHFA House Price Index for September 2015. This was originally a GSE only repeat sales, however there is also an expanded index. The consensus is for a 0.4% month-to-month increase for this index.
This graph shows New Home Sales since 1963. The dashed line is the August sales rate.
The consensus is for a increase in sales to 499 thousand Seasonally Adjusted Annual Rate (SAAR) in October from 468 thousand in September.
10:00 AM: University of Michigan's Consumer sentiment index (final for November). The consensus is for a reading of 93.1, unchanged from the preliminary reading.
All US markets will be closed in observance of the Thanksgiving Day Holiday.
The NYSE and the NASDAQ will close at 1:00 PM ET.
from Calculated Risk http://ift.tt/1YmdNy3
via YQ Matrix
Unilever Finds That Shrinking Its Footprint Is a Giant Task
By DAVID GELLES from NYT Business Day http://ift.tt/1jcLd28
This content was assembled for you by the YQ Matrix platform
The views expressed in this post and throughout the series are the autor's own and not intended to reflect the views the YQ Matrix platform, its users or any associated organisations.
For the procurement people among you, have a look at the latest YQ Matrix raw material and semi-finished prices. For: Prices on other websites.
Friday 20 November 2015
Kansas City Fed: Regional Manufacturing Activity expanded slightly in October, First Time since February
From the Kansas City Fed: Tenth District Manufacturing Activity was Largely Flat

from Calculated Risk http://ift.tt/1QypdNT
via YQ Matrix
The Federal Reserve Bank of Kansas City released the November Manufacturing Survey today. According to Chad Wilkerson, vice president and economist at the Federal Reserve Bank of Kansas City, the survey revealed that growth in Tenth District manufacturing activity was largely flat, although expectations for future activity improved considerably.The declines for most of this year in manufacturing activity, in the Kansas City region, was probably mostly due to lower oil prices and weaker exports due to the strong dollar.
“We saw our composite index move just slightly into positive territory for the first time since February, as some segments of durable manufacturing improved even as activity in our energy states remained sluggish,” said Wilkerson.
...
Tenth District manufacturing activity was largely flat in November, although expectations for future activity improved considerably from the previous few months. Most price indexes edged back down after rising slightly last month.
The month-over-month composite index was 1 in November, up from -1 in October and -8 in September
...
Most future factory indexes continued to rise after falling markedly a few months ago. The future composite index jumped from -1 to 8, and the future production, shipments, and new orders indexes also increased. The future employment index rose from 6 to 13, its highest level in nine months.
emphasis added
from Calculated Risk http://ift.tt/1QypdNT
via YQ Matrix
Price Briefing 13 – 19 November
India could revise down barite prices in wake of oilfield decline; iodine sinks further in Q3 but SQM remains positive about lithium.
from MPW - Pricing News http://ift.tt/1lydORq
via IFTTT
from MPW - Pricing News http://ift.tt/1lydORq
via IFTTT
Thursday 19 November 2015
DOT: Vehicle Miles Driven increased 2.3% year-over-year in August, Rolling 12 Months at All Time High
The Department of Transportation (DOT) reported:
The rolling 12 month total is moving up - mostly due to lower gasoline prices - after moving sideways for several years.
 Click on graph for larger image.
In the early '80s, miles driven (rolling 12 months) stayed below the previous peak for 39 months.
Miles driven (rolling 12) had been below the previous peak for 85 months - an all time record - before reaching a new high for miles driven in January.
The second graph shows the year-over-year change from the same month in the previous year.
 In August 2015, gasoline averaged of $2.73 per gallon according to the EIA. That was down significantly from August 2014 when prices averaged $3.57 per gallon.
Gasoline prices aren't the only factor - demographics is also key. However, with lower gasoline prices, miles driven - on a rolling 12 month basis - is setting new highs each month.
from Calculated Risk http://ift.tt/1PCHBF5
via YQ Matrix
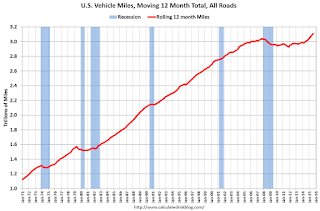
Travel on all roads and streets changed by 2.3% (6.3 billion vehicle miles) for August 2015 as compared with August 2014.The following graph shows the rolling 12 month total vehicle miles driven to remove the seasonal factors.
Travel for the month is estimated to be 277.3 billion vehicle miles.
◦The seasonally adjusted vehicle miles traveled for August 2015 is 263.3 billion miles, a 3.6% (9.1 billion vehicle miles) increase over August 2014. It also represents a -0.4% change (-1.2 billion vehicle miles) compared with July 2015.
The rolling 12 month total is moving up - mostly due to lower gasoline prices - after moving sideways for several years.
In the early '80s, miles driven (rolling 12 months) stayed below the previous peak for 39 months.
Miles driven (rolling 12) had been below the previous peak for 85 months - an all time record - before reaching a new high for miles driven in January.
The second graph shows the year-over-year change from the same month in the previous year.
Gasoline prices aren't the only factor - demographics is also key. However, with lower gasoline prices, miles driven - on a rolling 12 month basis - is setting new highs each month.
from Calculated Risk http://ift.tt/1PCHBF5
via YQ Matrix
Subscribe to:
Posts (Atom)